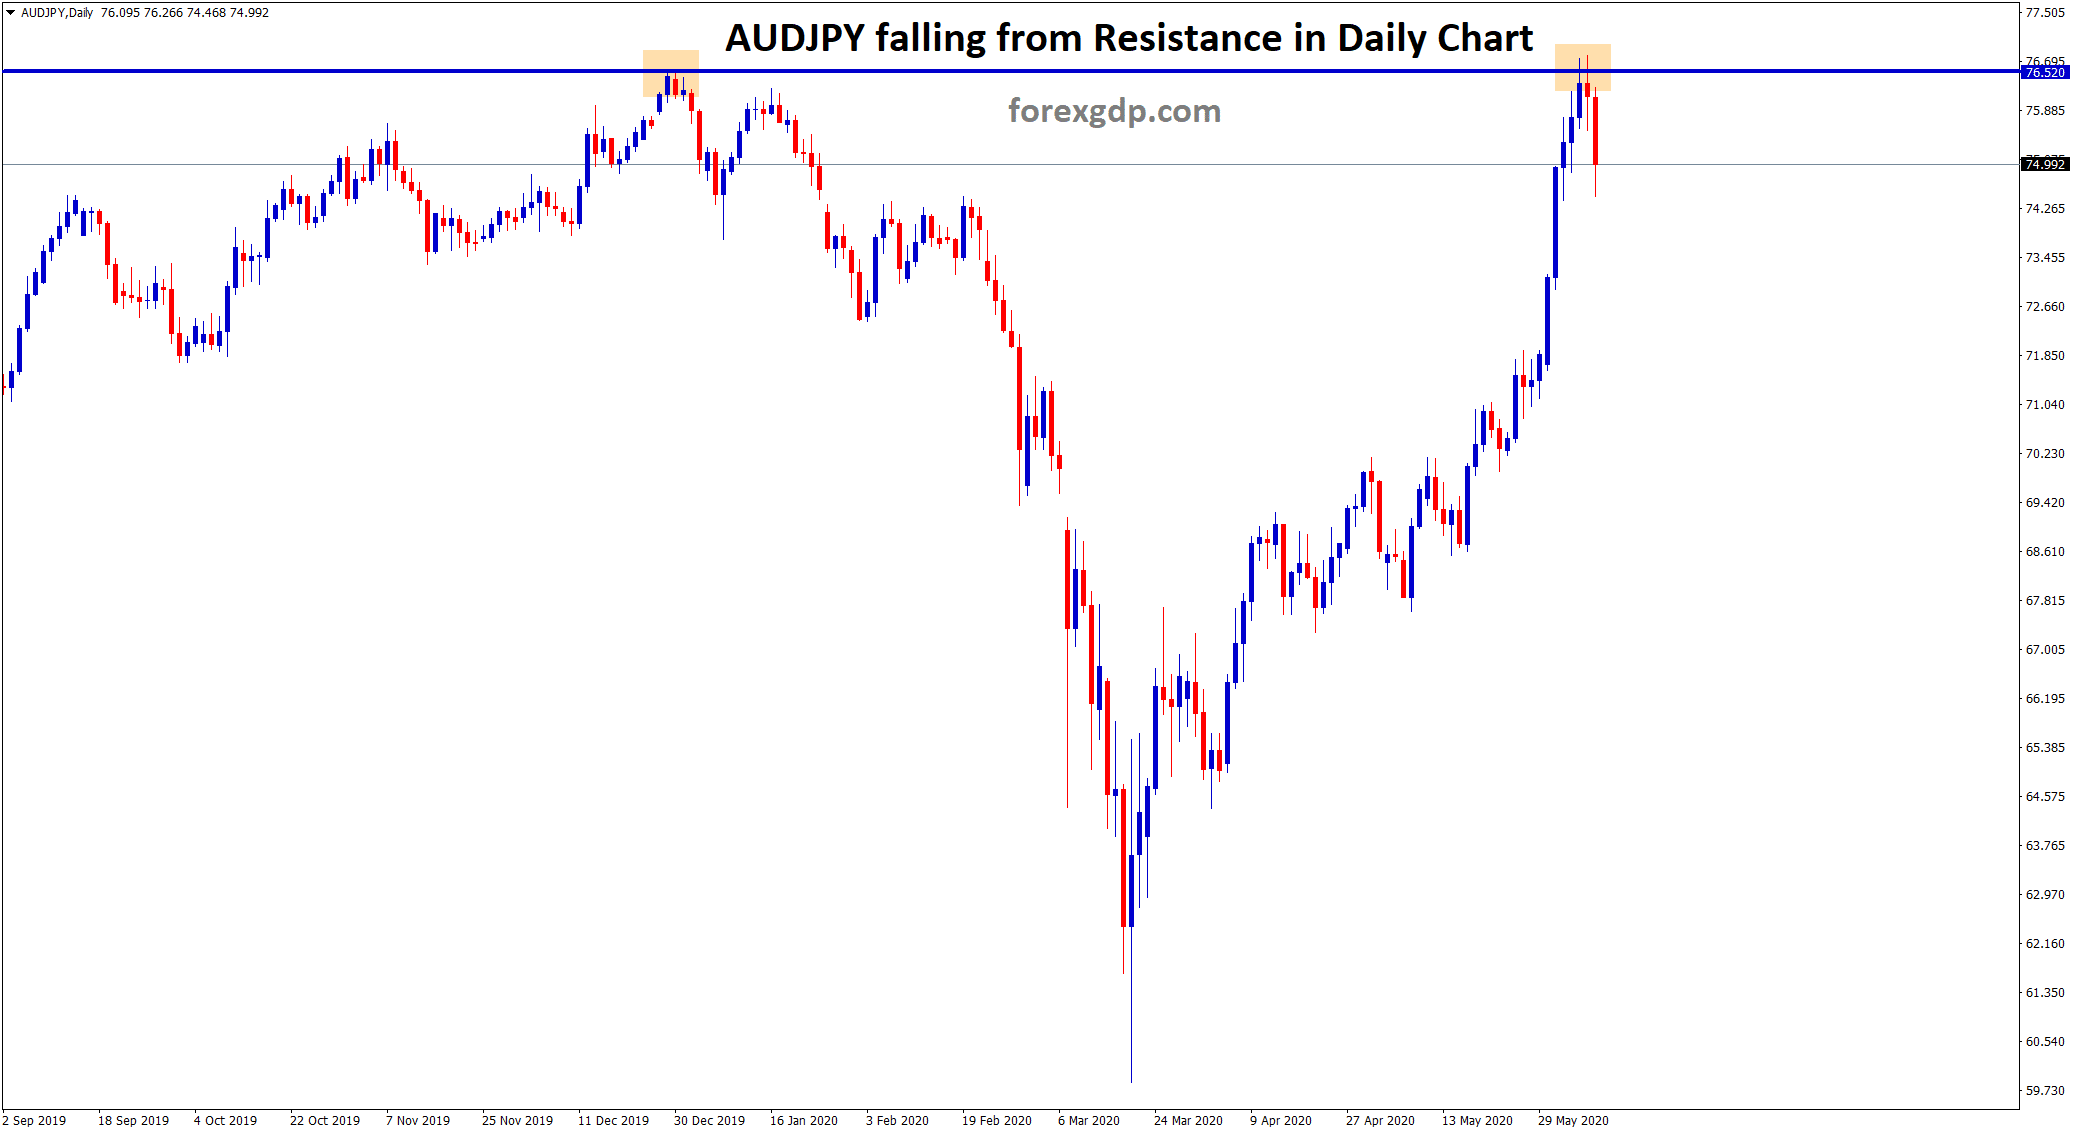
AUDJPY Falling from the Resistance Zone
AUDJPY is moving up continuously for long time without much corrections.
Now, AUDJPY Starts to fall from the strong resistance level in Daily chart.
Today, AUDJPY broken the Bottom level of the Up Trend line in thirty minutes timeframe.

USDJPY Starts to fall from 109.80 which is the top level of the Symmetrical Triangle in daily chart.
After japan economy going into recession period, Yen currency pairs is making a corrections now.
New Zealand economy got recovered completely from Corona virus, Australian Economy going to reach 100% recovery soon.
Due to Covid-19, all the financial markets made a big movements, once the recovery is complete, we can expect fast price recovery in all markets unless it is strong enough to survive in this covid-19.
If you like to receive the best forex signals at good trade setup, you can Try free forex signals. (or) if you need additional important trade signals with high accuracy, Join now in Supreme or Premium forex signals plan.
If you want to learn trading from 20+ years expert traders, Join forex trading course online now.
Thank you.