

Candlestick charts look simple on the surface—just a series of sticks lining up like soldiers on a battlefield. But beneath that simplicity lies a world of hidden emotions, market psychology, and financial warfare. Each candle holds a message, a whisper from traders across the world telling you what they believe, fear, and expect next. When you look closely enough, every candle tells a story—and if you can learn to read that story, you gain an edge that many traders overlook.
In this long, detailed guide, you’ll dive deep into the meaning behind every candlestick, how to decode their patterns, and why ignoring them could sabotage your trades. Whether you’re new to trading or you’ve been around long enough to know better, this will open your eyes to the true power of candlestick storytelling.
Understanding The Silent Language of Candlesticks
Candlesticks as Emotional Narratives
Candlesticks aren’t just indicators—they’re emotional footprints left behind by millions of traders. Every wick, body, and close tells you how the market reacted to fear, greed, hesitation, or confidence. When a candle forms, it shows who won the battle between buyers and sellers. This tiny piece of data can reveal more than pages of technical analysis if you know how to interpret it.
Think of candlesticks like diary entries from the market itself. They reveal the market’s mood swings, frustrations, and breakthroughs. Some candles appear calm and predictable, while others scream chaos. Learning to read these subtle emotional cues can save you from entering bad trades or missing powerful opportunities.
Why Candles Matter More Than Indicators
Most beginners overload their charts with indicators. It’s like trying to read a book through foggy glasses. Candlesticks give you raw, clean data—straight from the source. Indicators lag, but candle movements don’t lie. They show price action as it happens, allowing you to make smart decisions instead of late reactions.
When you stop depending fully on indicators and start using candles as your guide, your understanding of market behavior sharpens. You begin to see trends before they fully form, reversals before they become obvious, and traps before they swallow your capital.
Decoding the Anatomy of a Candle
The Body: The Market’s Heartbeat

The candle body represents the fight between buyers and sellers during a specific timeframe. A large body signals intensity. A small body whispers uncertainty. By watching the body size, you can instantly gauge who had more power in that round of trading.
Large bullish bodies often signal buyers gaining momentum—almost like the market taking a huge breath before sprinting. Large bearish bodies, on the other hand, indicate sellers crushing buyers with pressure. These signals are clues pointing to what might unfold next.
The Wicks: Whispers From the Market
Wicks, or shadows, tell you about price rejection. Long wicks are signs of dramatic pushbacks. When you see a long upper wick, it means buyers tried to dominate but failed—and sellers kicked them down. Long lower wicks reveal the opposite: buyers swooped in to rescue the price before it fell further.
Ignoring wick behavior is like ignoring someone’s tone of voice during a conversation. You miss half the meaning.
The Close: The Final Verdict
The candle close shows who ultimately won the battle. Traders often underestimate the power of the closing price. It determines whether the market ends the fight strong, weak, confused, or exhausted. It’s the final word that sets the tone for the next candle.
A candle closing near its high screams bullish strength. One closing near its low reveals bearish aggression. And a candle closing in the middle? Well, that’s the market shrugging its shoulders.
The Story Behind Bullish Candles
When Buyers Take the Lead
A bullish candle isn’t just a green bar—it’s proof that buyers stepped into the ring and dominated. But not all bullish candles are the same. Some are shy hints of momentum; others are loud roars. The key is identifying which story each bullish candle tells.
If you see a long bullish candle in a downtrend, that’s not random. It’s the first spark of rebellion against the dominance of sellers. It’s the moment where buyers start regaining confidence, even if just a little.
Bullish Candles That Trick Traders
Not every bullish candle signals safety. Some are traps—fake pushes to lure emotional traders. A candle that appears strong but forms near resistance may be nothing more than a market illusion. These “fake friends” candles pull traders into losing positions.
Bullish candles should always be analyzed in context. Without context, they’re just shapes. With context, they become powerful tools for predicting market turns.
The Story Behind Bearish Candles
Sellers Taking Control
A bearish candle tells a darker story: one of pressure, fear, and force. When sellers dominate, the candle bodies become longer and more forceful. They signal panic selling, trapped buyers, and shifting market sentiment.
In many cases, bearish candles reveal hidden cracks in market confidence. Traders who see this early avoid painful losses that come from blindly following uptrends.
The Power of Strong Rejections
Some bearish candles appear harmless—until you notice their wickedly long upper wicks. These are warning signs that buyers attempted to push prices higher but got crushed. It’s like the market sending a clear message: “Don’t even think about going up.”
Traders who ignore bearish rejection candles often walk straight into reversals.
Candlestick Patterns that Reveal Market Secrets
Reversal Patterns That Save Traders From Disaster
Reversal candles are game-changers. They show the exact turning point where the market decides to shift direction. Patterns like engulfing candles or hammers are like signals from the universe telling you it’s time to adjust your position.
When you understand reversal patterns, you stop trading blindly and start aligning your actions with the market’s true intentions.
Continuation Patterns That Confirm Market Trends
Not all candles warn of danger. Some candles reassure you that the trend you’re following is still strong. Continuation patterns tell you the market is simply taking a breath before continuing in the same direction.
They’re subtle but incredibly powerful for swing and position traders.
Market Psychology Hidden Behind Candles
Fear and Greed in Every Tick

The forex market is nothing but a battlefield of emotions. Traders panic. Traders become greedy. Traders hesitate. Every candle reflects these emotions, whether you realize it or not. When you see huge bearish candles in a strong uptrend, that’s fear entering the market. When you see long bullish candles despite weak fundamentals, that’s greed muting logic.
Recognizing these emotional imprints helps you avoid joining the losing side of the fight.
Why Traders Ignore the Signs
Most traders fail not because they lack strategy, but because they ignore the story candles tell. They enter trades too late, exit too early, or blindly trust indicators. But price action—pure candlestick movement—never lies. It reveals truth before indicators even wake up.
How Candles Help You Avoid Costly Mistakes
Spotting Market Manipulation
Big players love manipulating price. They push prices up or down just to trap retail traders. Candlestick behavior often exposes these manipulations. Sudden long wicks, dramatic reversals, or unnatural candle sizes reveal that something suspicious might be happening.
If you learn to spot these manipulations, you protect your capital with precision.
Reading Candlesticks in Key Zones
Candles near support and resistance levels tell the most honest stories. A bullish candle at support reveals strength. A bearish candle breaking support shows a potential meltdown. These zones amplify candle behavior, turning simple formations into powerful signals.
Mastering the Art of Integration
Candles and Trendlines
Candles help you confirm whether a trendline will break or bounce. A strong rejection candle at a trendline signals continuation. A powerful close beyond the line signals a breakout. Use candles and trendlines together, and your trading accuracy skyrockets.
Candles and News Events
News can cause candle chaos. Suddenly, wicks stretch like rubber bands and bodies explode with force. By reading candle reactions to news, you can avoid being caught in volatility storms.
The Role of Patience When Studying Candles
Waiting for Confirmation
Jumping into a trade after a single candle is like judging a book by its cover. Patience saves you. Confirmation candles help you avoid traps and trade safely. When you wait for the story to unfold, you improve your decision-making dramatically.
Avoiding Emotional Trading
Candlesticks help you detach from emotion. When you read them objectively, you stop reacting based on fear or excitement. You start acting on facts.
Why Every Candle Truly Tells a Story
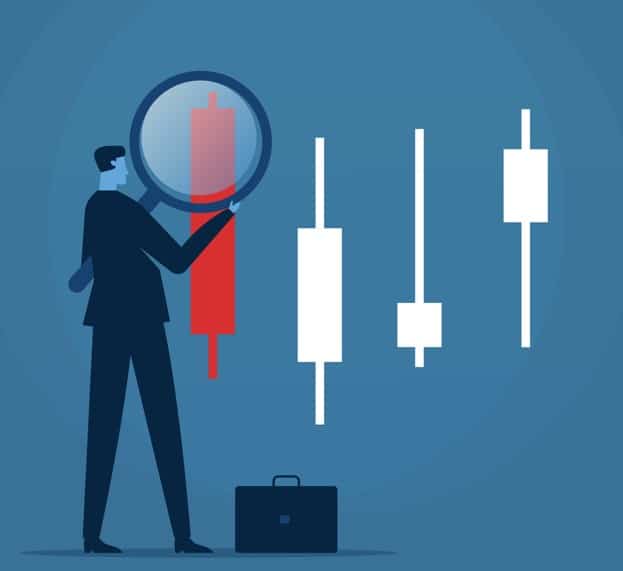
Each candle is a sentence in the market’s ongoing story. Some sentences are dramatic. Others are dull. Some hint at what’s coming. Others mislead you on purpose. But when you read the entire story instead of focusing on single words, you begin to trade with clarity and purpose.
Candlesticks don’t just show price—they reveal the truth behind price. And truth, in forex, is worth more than gold.
Conclusion
Candlestick reading is more than a skill—it’s an art. Each candle represents the voice of millions of traders reacting to the market in real time. When you learn to listen to that voice, you shift from guessing to understanding. You begin trading not with fear or confusion, but with confidence and insight. And once you master this art, you’ll never look at a chart the same way again. Because every candle really does tell a story—one that can guide your trading journey if you choose to listen.
FAQs
1.Are candlesticks more reliable than indicators?
Yes. Indicators lag, but candlesticks show real-time market behavior, allowing quicker, more accurate decisions.
2.Can I trade using candlesticks alone?
Absolutely. Many traders rely solely on price action. Still, combining them with zones or trendlines improves accuracy.
3.Why do some candles give false signals?
Market manipulation, low liquidity, or trader exhaustion can create misleading candles—context is crucial.
4.How long does it take to master candlestick reading?
It varies. With daily practice, most traders improve significantly within a few months.
5.Are wicks more important than candle bodies?
Both matter, but wicks often reveal hidden power shifts and rejections that bodies don’t show.