
Do you feel, “Why the market is going against you?“
“Which Forex trading strategy is really profitable all the time?”
The Top most answer comes from Big Traders including Warren Buffet is : Support and Resistance
♦ Low Risk High Reward Trading Strategy
♦ How to confirm breakout in trading?
♦ How to confirm reversal in trading?
♦ Why Retest happen after breakout?
♦ Should you trade the breakout or wait for a retest?
♦ Using Pending orders, Alerts for entering at accurate time
♦ How to trade Support and Resistance?
♦ How to identify Major and Minor Support or Resistance Level?
♦ Fast movement Vs Slow movement
Support and Resistance is one of the best forex trading strategies that are working well for more years. But, you should have to know the rules how to trade support and resistance properly.

Now, we going to see the best working support and resistance strategies step by step.
Before going to support and resistance, you should know the meaning of “Level”.
If the market reach and bounce back from particular price, that price is called level.
Support is the bottom price level.
Resistance is the top price level.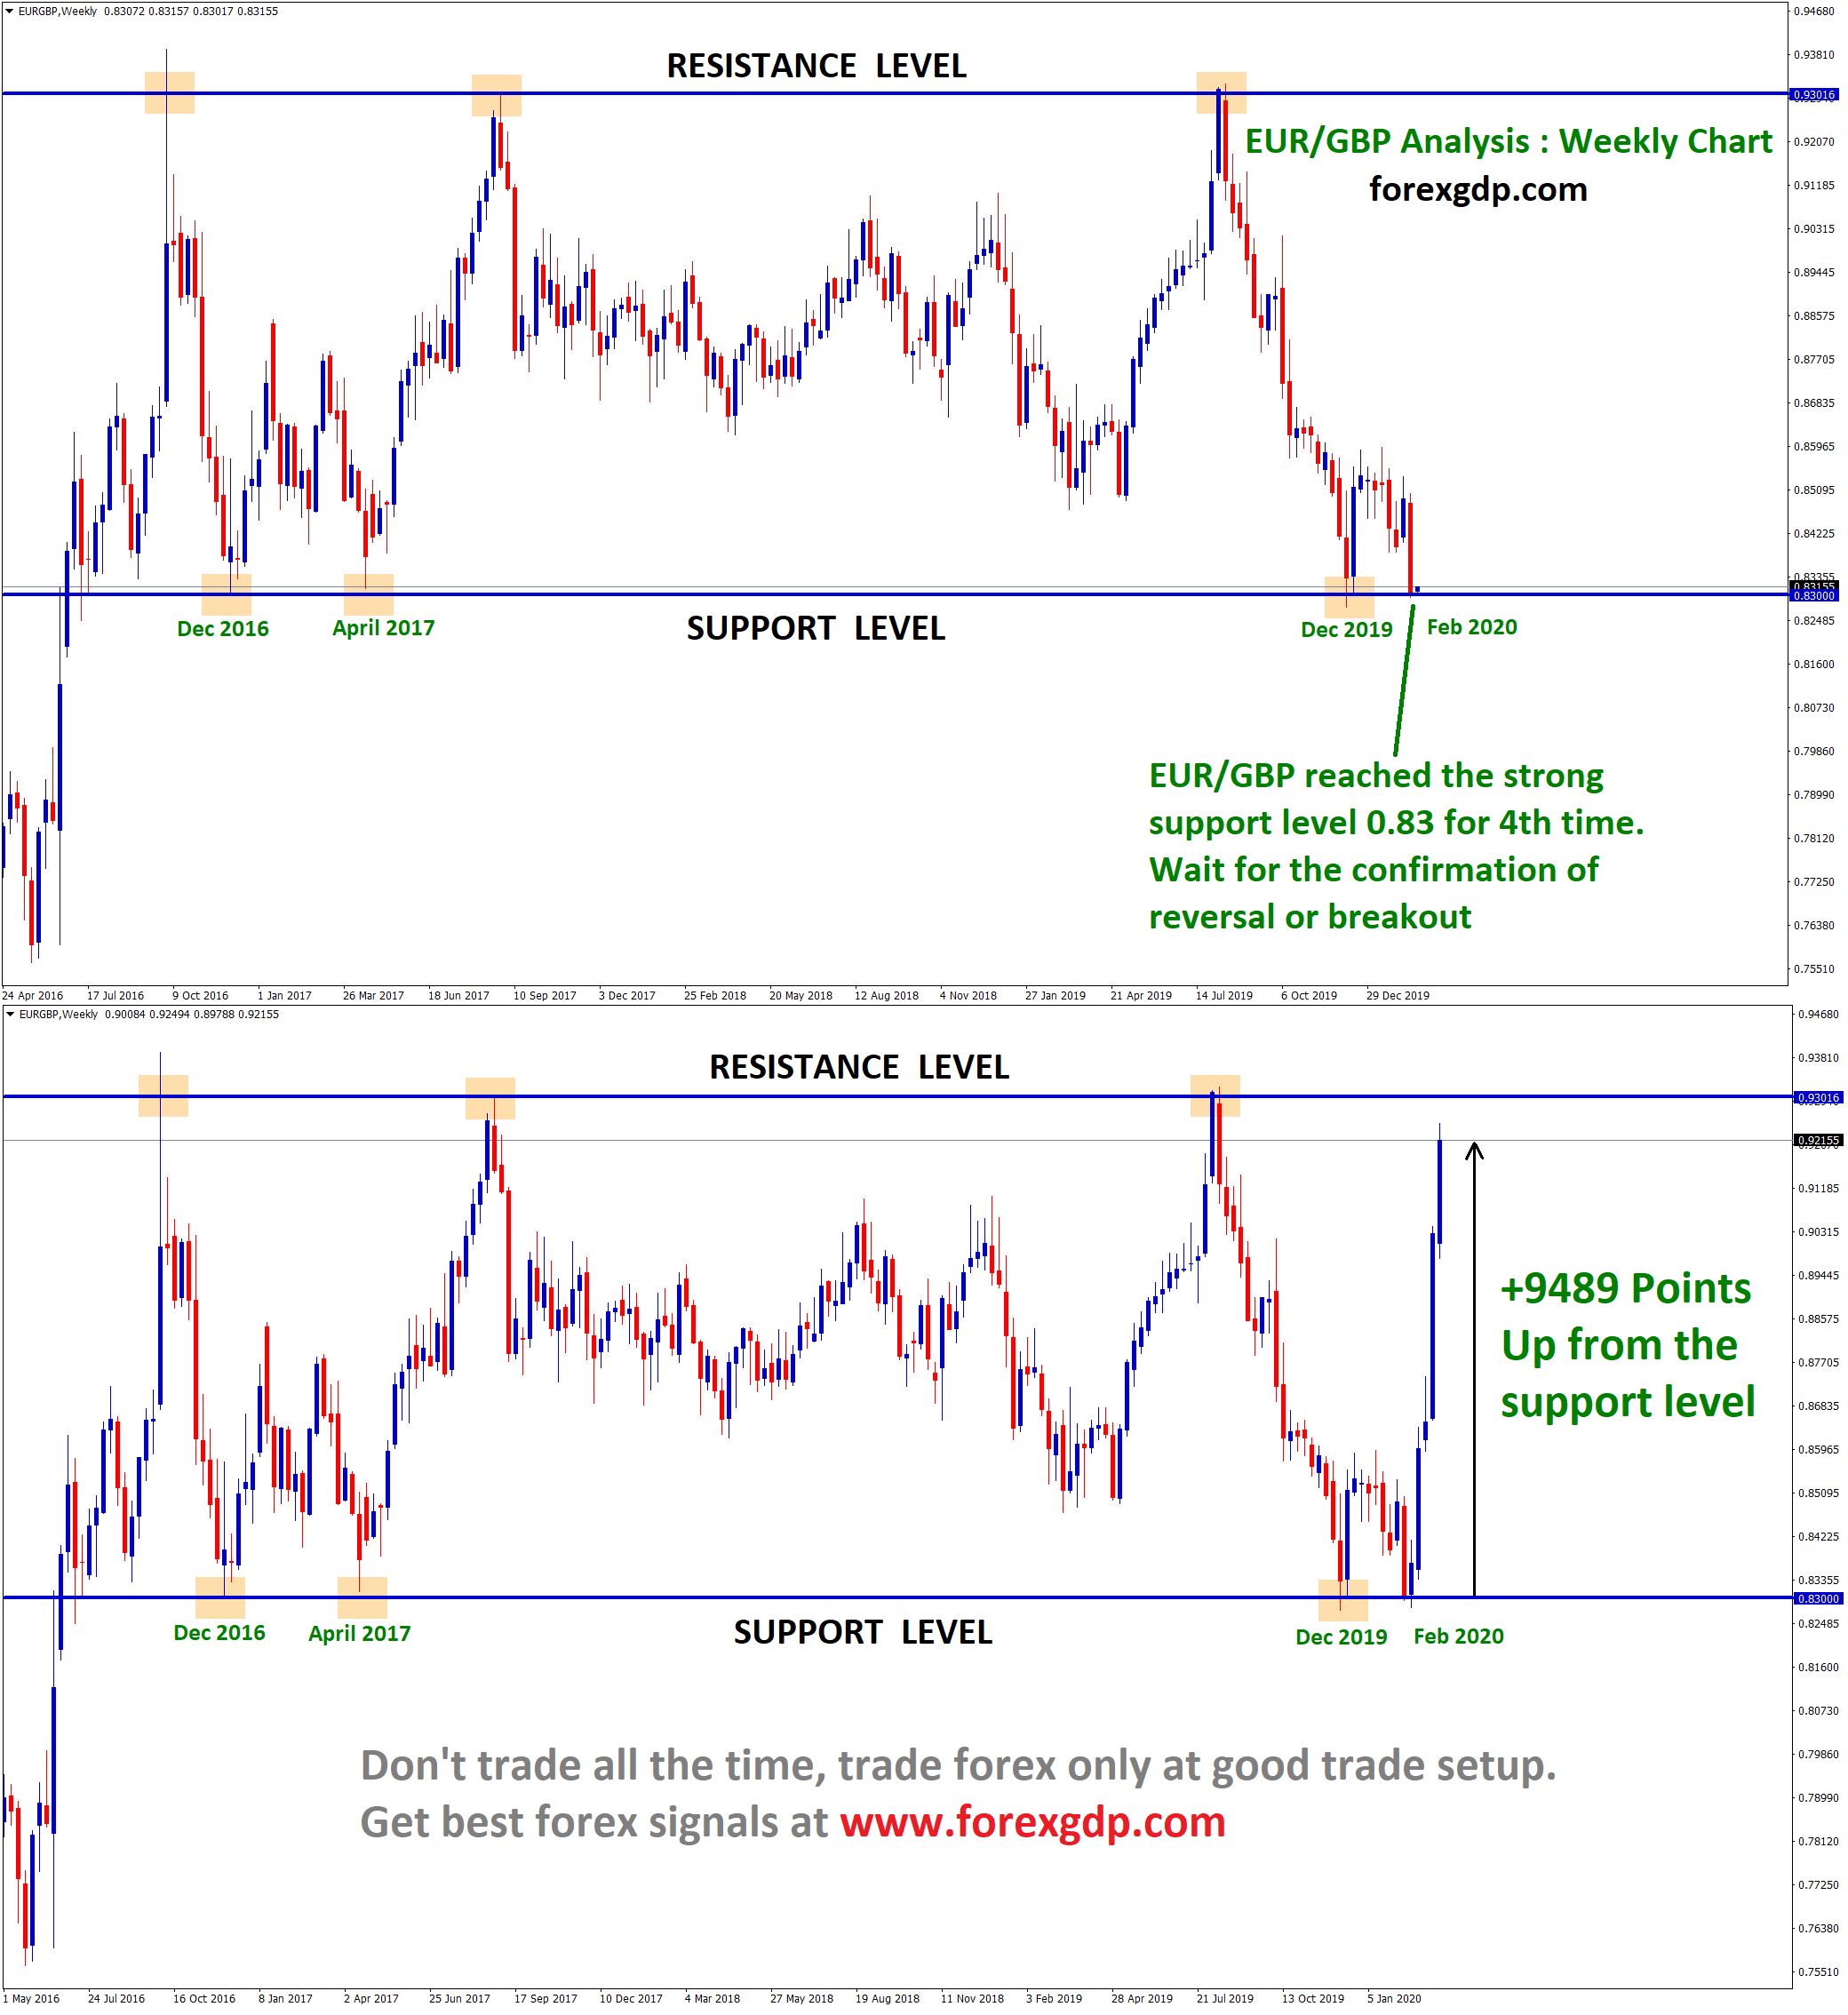
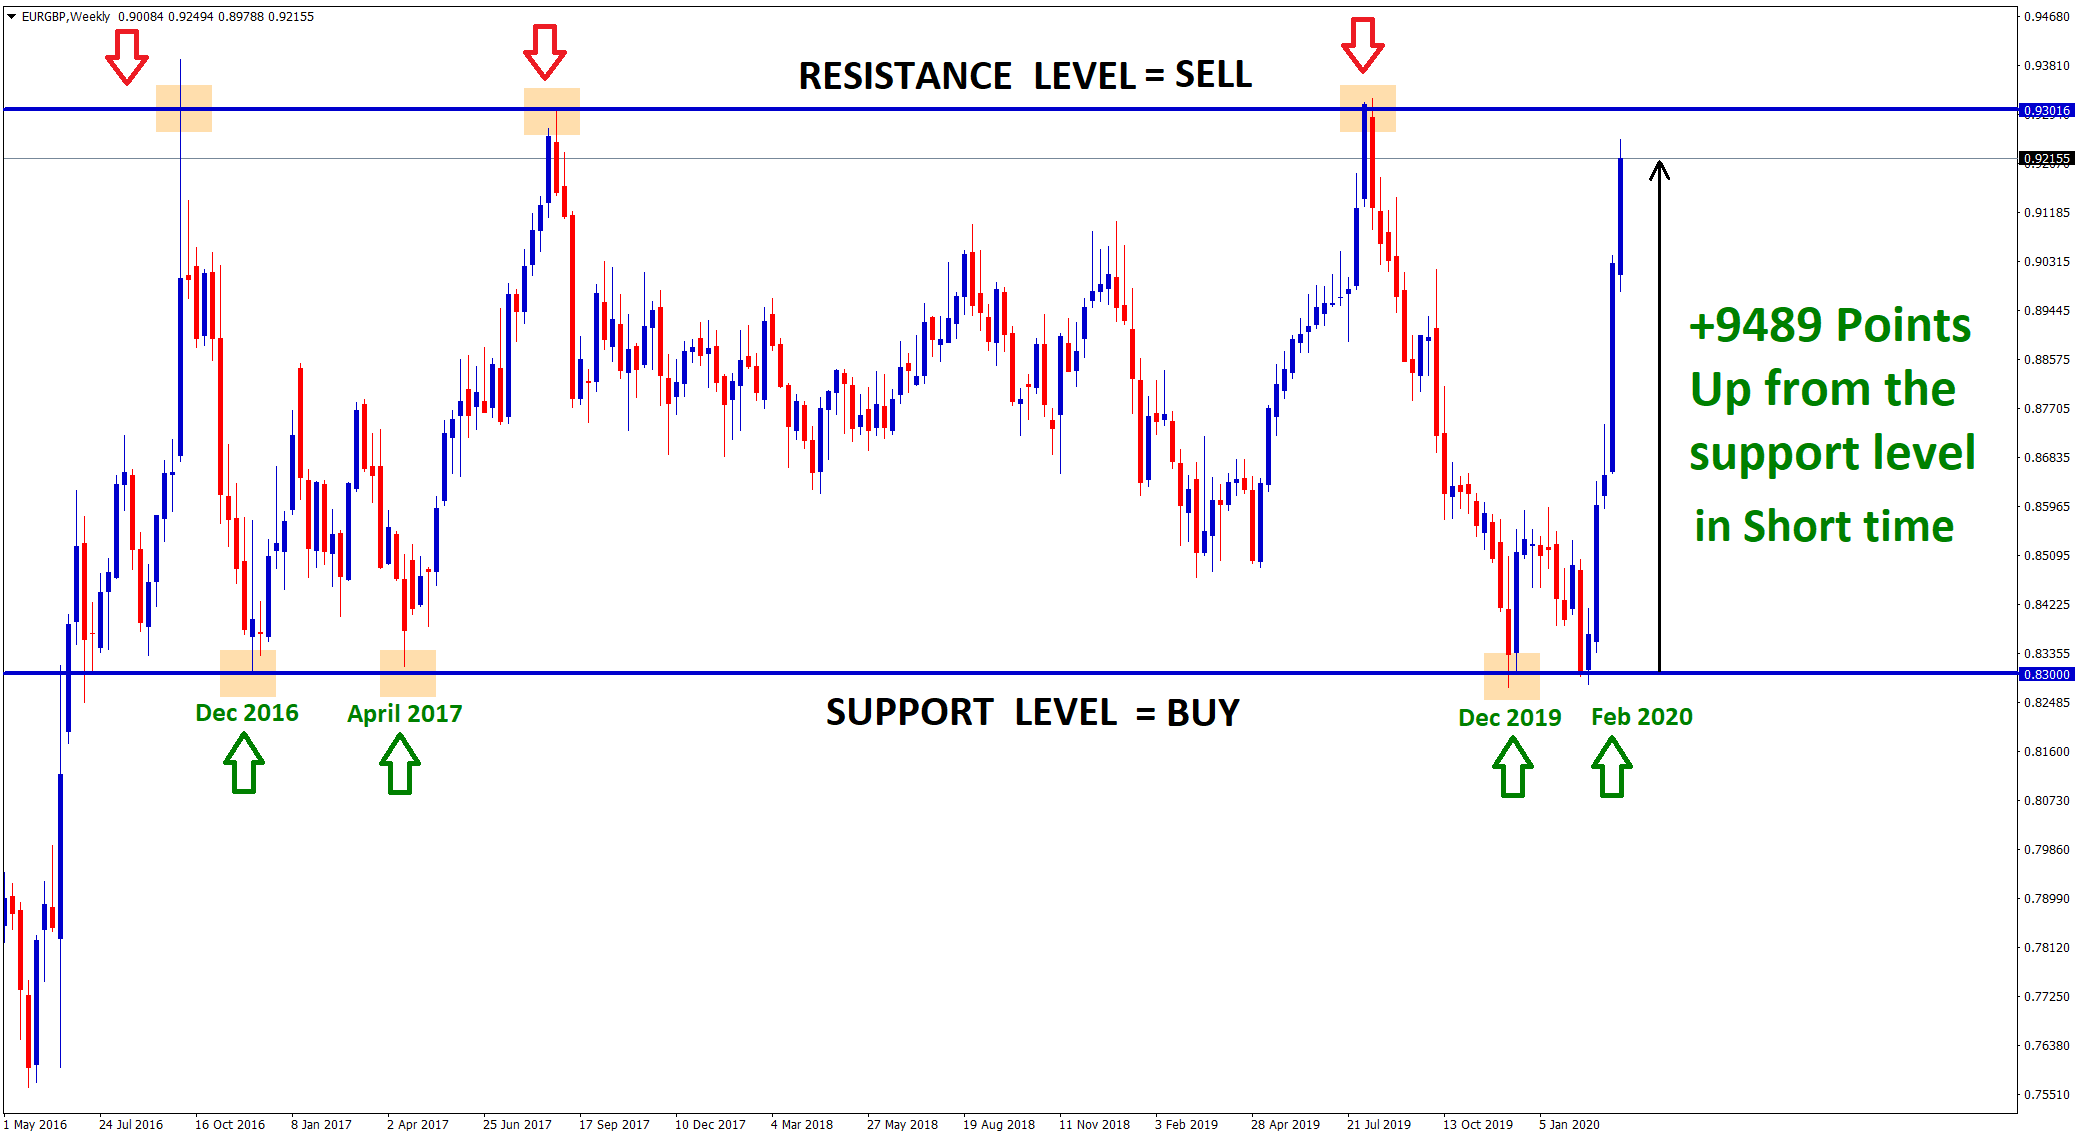
Support and Resistance level are more powerful as you see in this EURGBP Chart analysis. After hitting the support level, Market went up +9489 points profit in short time.
Zoom out your chart to maximum mode, Look for sideways movement in the chart with rectangle structure as shown in the above image.
Example : If you throw a rubber ball inside your room from the top. what will happen?
The ball will hit the ground and bounce back again to the top wall right?
Similarly,
If market hit particular price level, it will bounce back and keep moving up and down. 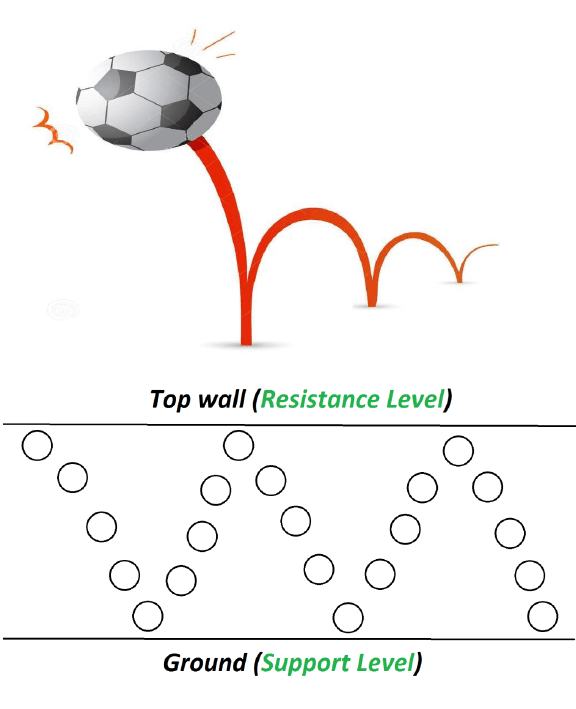
Here, the Top Ceiling wall is considered as a Resistance level and Ground level is considered as a support level. So, when you throw a ball inside the room, it will keep moving up and down within the Resistance and Support level. Same applies to our Market Movement.
market starts to move within a specific price range between resistance and support level, it behave similar to this bouncing ball example.
If you find the market moving flat in sideways, draw a horizontal line at the top price level and another line at the bottom price level.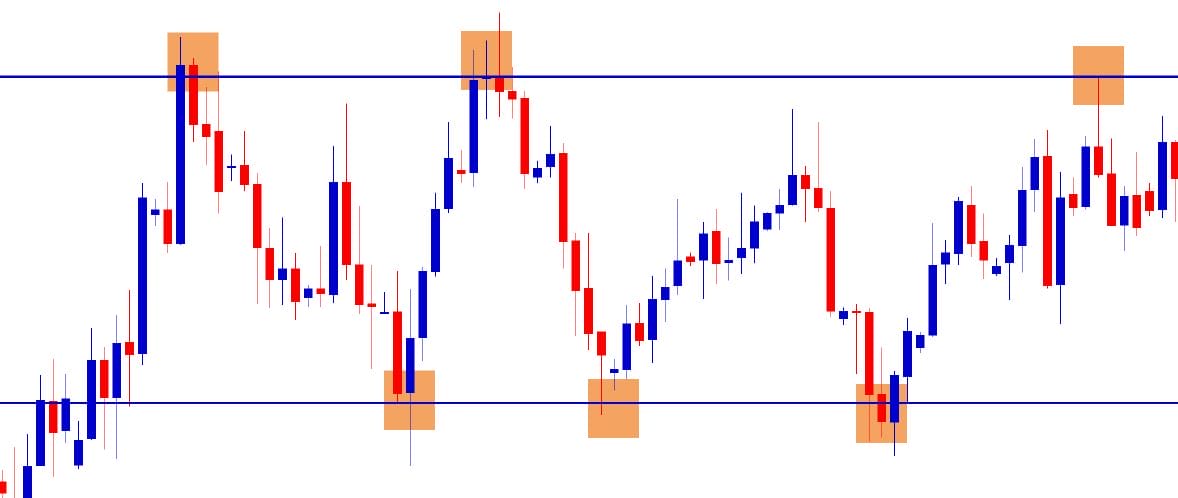
The Top line is Resistance and the bottom line is support level. Now, you got some idea about support and resistance level. Let’s see how to make profit using the support and resistance trading strategy.
The Resistance Level
In general resistance means an Obstacle. In the forex market, resistance is something which stops the price from rising further.
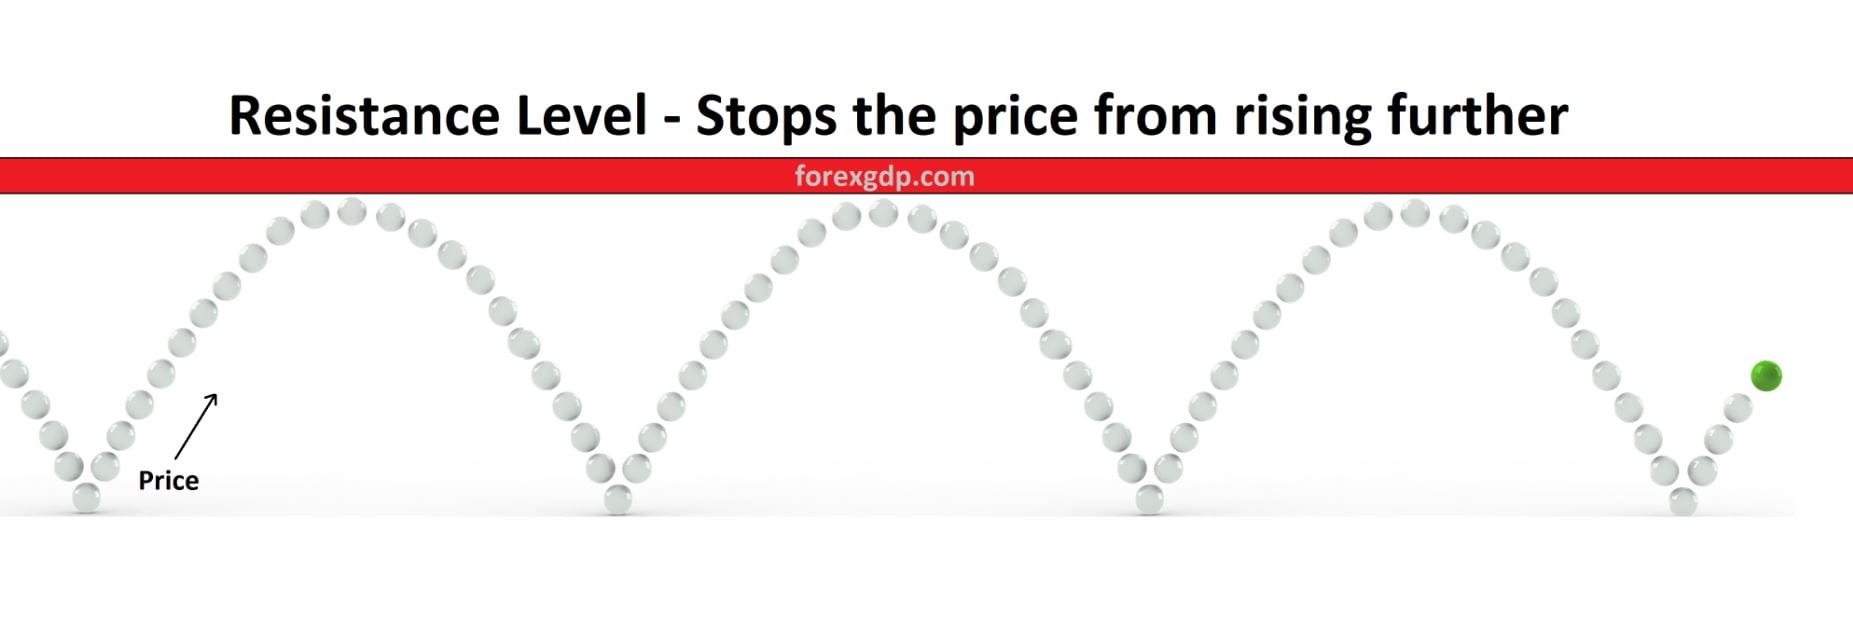 The resistance level is the top price point on the chart where traders expect maximum supply (in terms of selling) in the market.
This resistance level is the hot price zone where sellers dominate more than buyers. We can expect market to fall down from the resistance level.
All the traders look for selling at the resistance level, so the number of sellers will increase and buyers will decrease.
If the gap increases between number of sellers and buyers, then market starts to move in single direction. At this situation, if sellers quantity were huge, then market starts to fall from the resistance level.
More sellers from Resistance level = Fast fall
Less sellers from Resistance level = Slow fall
Let’s see the example of fast fall and slow fall from the Resistance level.
Example :
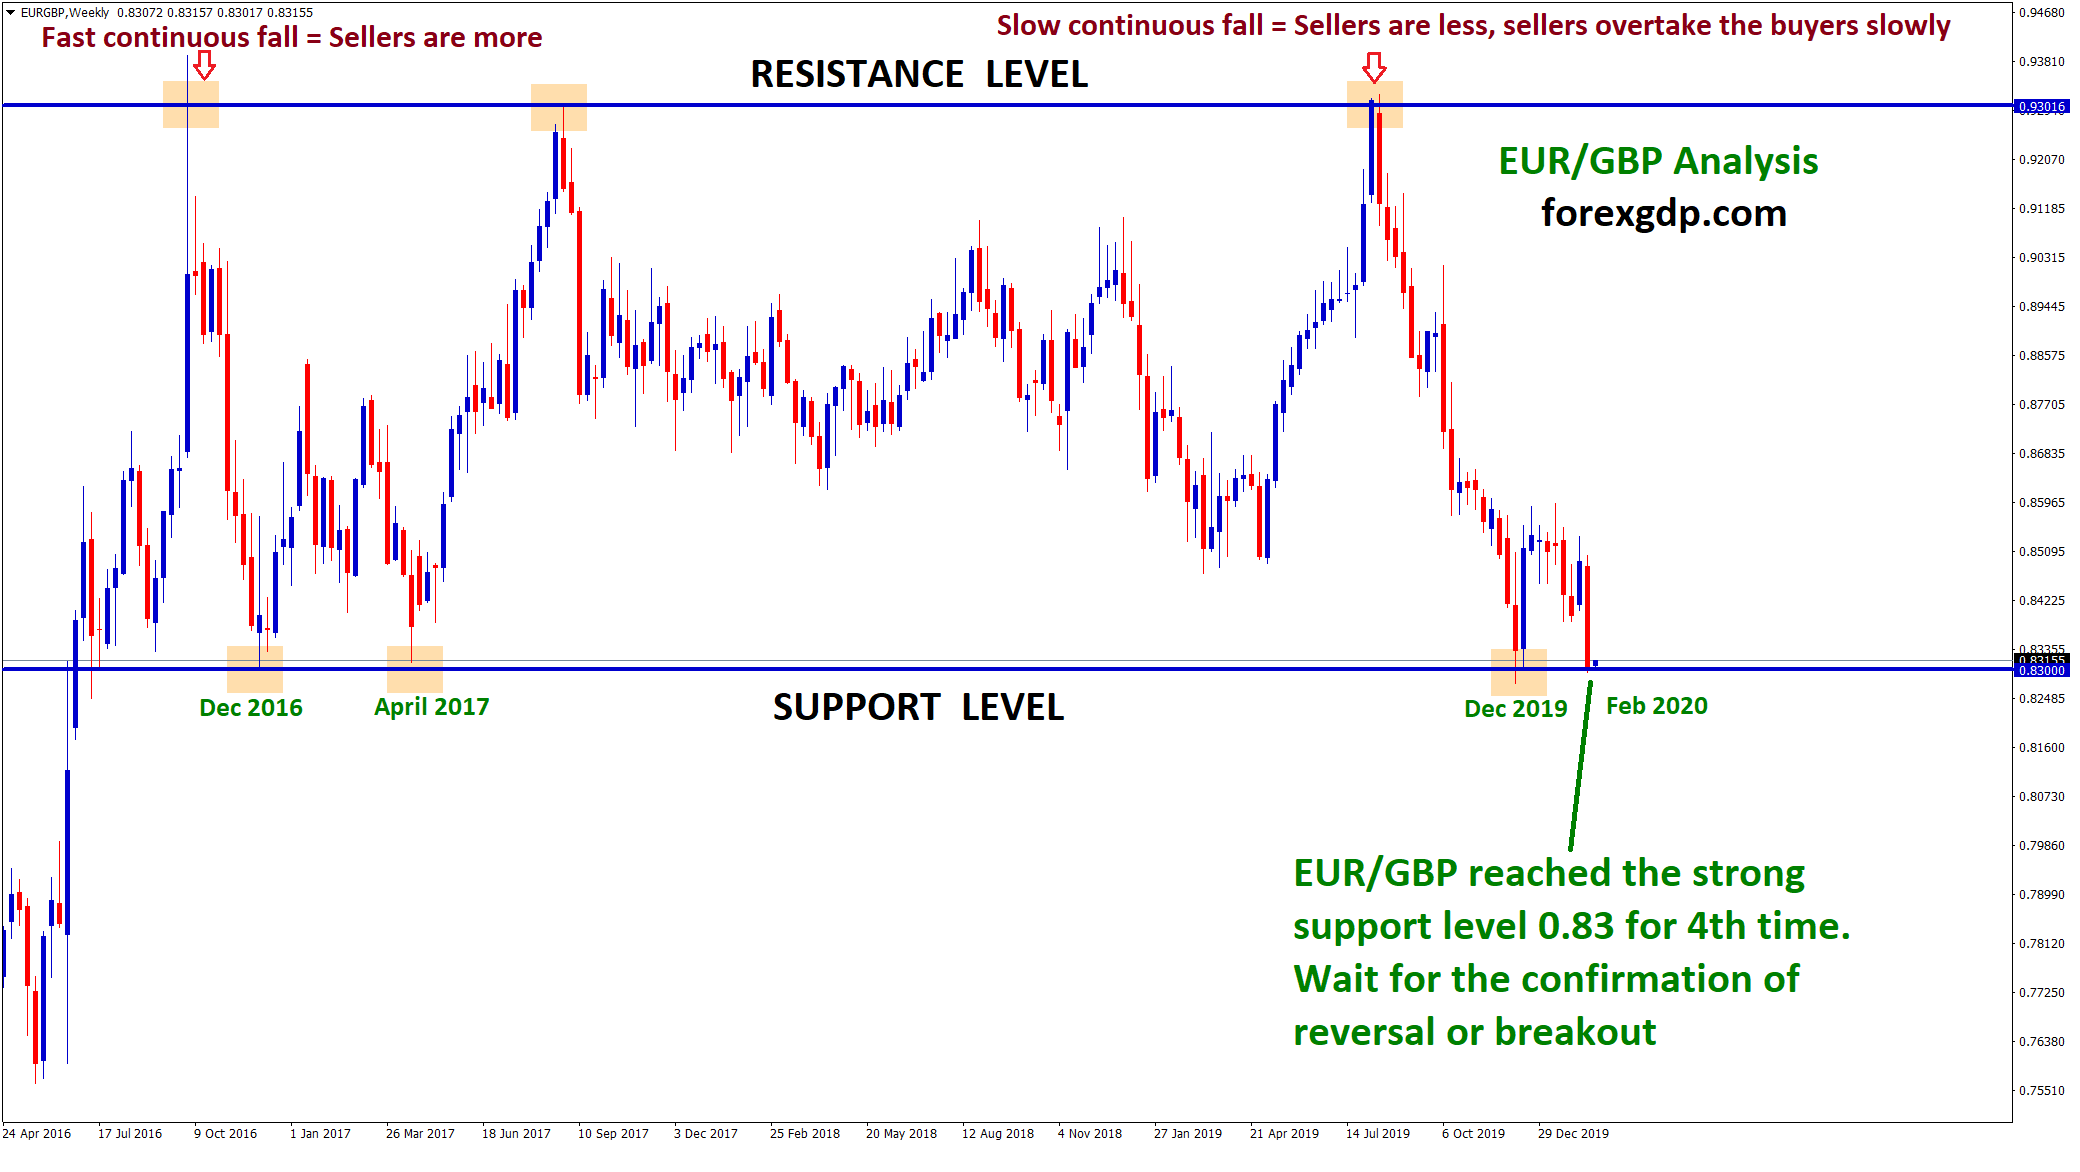
If you look the above chart, after market reaching the resistance level for first time, A big spike in candlestick has formed at the resistance. The number of sellers are huge when comparing to buyers. Sellers dominated at this top resistance price level. This is the reason market fall down faster back to the support level in short time.
If you notice the 3rd fall from the resistance, there’s no spike and you can see the number of red candles (bear) from resistance level are small in size, but there’s continuous red candles formed steadily. So, it is a slow continuous fall which shows that Sellers are overtaking the buyers slowly.
Now, if you compare the first fall and third fall from the above EURGBP Resistance chart, you will notice the difference between Fast fall and Slow fall from the resistance level.
In technical terms, Resistance Level is the place where:
- Demand decreases and Supply increases.
- Excess supply builds selling pressure.
- Sellers dominate more than buyers at the resistance level.
As per our Rubber ball example, The resistance level act as a Top Ceiling wall in your room, whenever market reaches the resistance level, we can expect a fall or correction.
The Support Level
The support level is simply opposite to the resistance level. Support level is something that prevents the price from falling further.
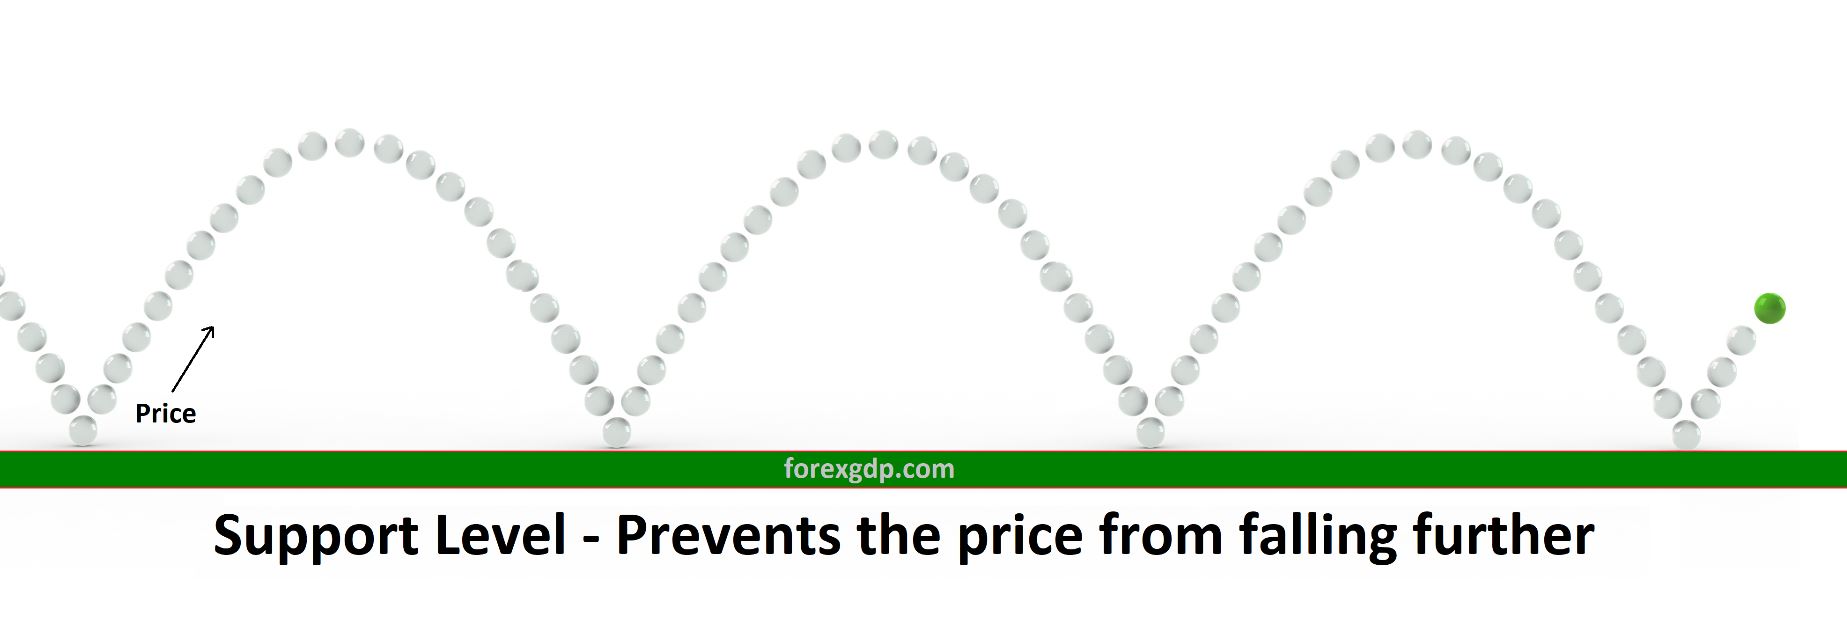
The Support level is the bottom price point on the chart where traders expect maximum demand (in terms of buying) in the market.
The support level act as a hot price zone where buyers dominate more than sellers.
Support Level is the place where market is oversold, big buyers starts to enter at the support level and sellers get reduced due to high demand in the market.
All the traders look for price rise at the support level, So the number of buyers will increase and sellers will decrease.
If buyers overtake the sellers, you can see the market price rise (bounce back) from the support level.
More buyers from Support level = Fast continuous price rise
Less buyers from Support Level = Slow price rise
Let’s see the example of fast rise and slow rise of the market from the resistance level.
Example :

If you look the above chart, after market reaching the support level for 1st, 2nd, 3rd time, Market went up slowly by forming small bull candles which shows that buyers are overtaking the sellers slowly.
But in the 4th time visit, Huge demand increases the number of buyers suddenly when comparing to sellers. Huge big bull candles formed. So the market gets dominated by the Buyers at this support price level. This is the reason market price rise faster from the support level in short time.
In technical terms, Support level is the place where:
- Demand increases, supply decreases
- Excess Demand builds buying pressure
- Buyers dominate more than sellers at the support level.
As per our Rubber ball example, The support level act as a ground in your room, whenever market reaches the support level, we can expect a bounce back like a ball bouncing after hitting the ground level.
How to trade Support and Resistance?
It is very easy to trade support and resistance level in forex market. However, you need to be aware of breakout trading at support and resistance level.
- If the market came to the Resistance, place a Sell trade.
- If the market came to the Support level, place a Buy trade.
Check the example chart below : Here, we simply use this formula.
Resistance = SELL ↓
Support = BUY ↑
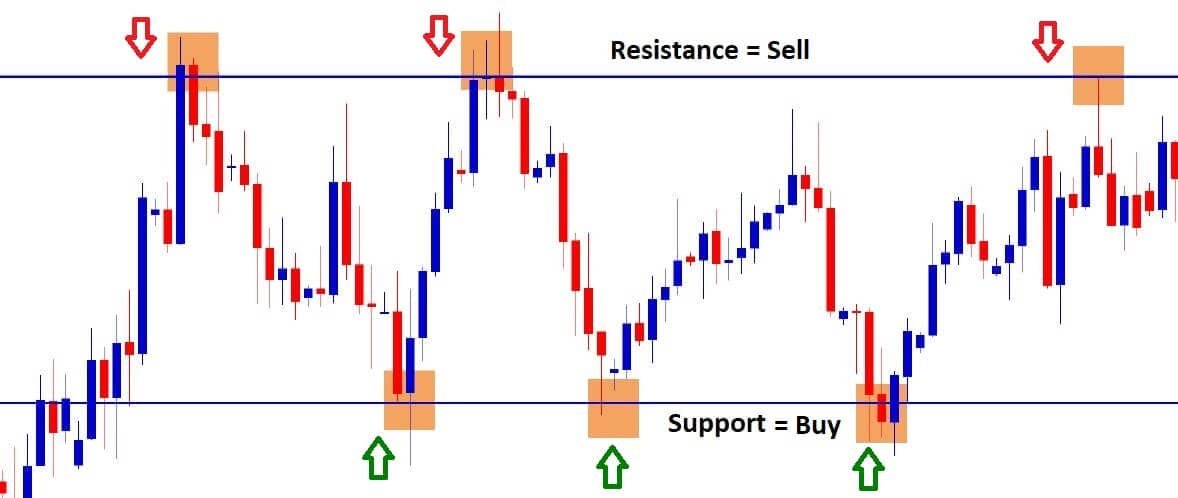
Another Example :
Looks easy?
Wait….Wait… I have a question…
How long you need to wait for the market to reach resistance or support level?
what happen while you sleeping, if the market hits the resistance or support price level and reverse back? do you miss the trade?
Yes, of course.
You might miss the good opportunity trade.
But don’t worry, we have a solution for placing the trade without missing the good opportunities. We are going to use pending orders or alerts for catching the best price trade.
Using Pending orders for trading support and resistance
For placing Sell order at the resistance, you can use “pending order – sell limit” at the resistance price level.
For placing buy order at the support level, you can use “pending order – buy limit” at the support price level.
How to place Pending orders in Trading?
Watch this video for learning all 4 types of pending orders.
Using Alerts for trading support and resistance
If you don’t like to use pending orders, but you want to take the trade live in real time. Then we prefer you to set “alert” sound, popup, notification, SMS, etc,. provided by your trading platforms.
- MT4 – MetaTrader 4
- MT5 – MetaTrader 5<
- cTrader<
- Tradingview
These Trading software help you for getting automatic notification message when the market price hits your support or resistance level.
Low Risk High Reward Trading Strategy using Support and Resistance
How to place Sell trade at the Resistance level with small risk?
After market reaching resistance, Place Sell Trade exactly at the Resistance level with small stop loss
And Take profit should be placed just above the support zone.
Don’t keep the take profit exactly at the support line, just set your take profit price few pips above the support level.
Example Chart :
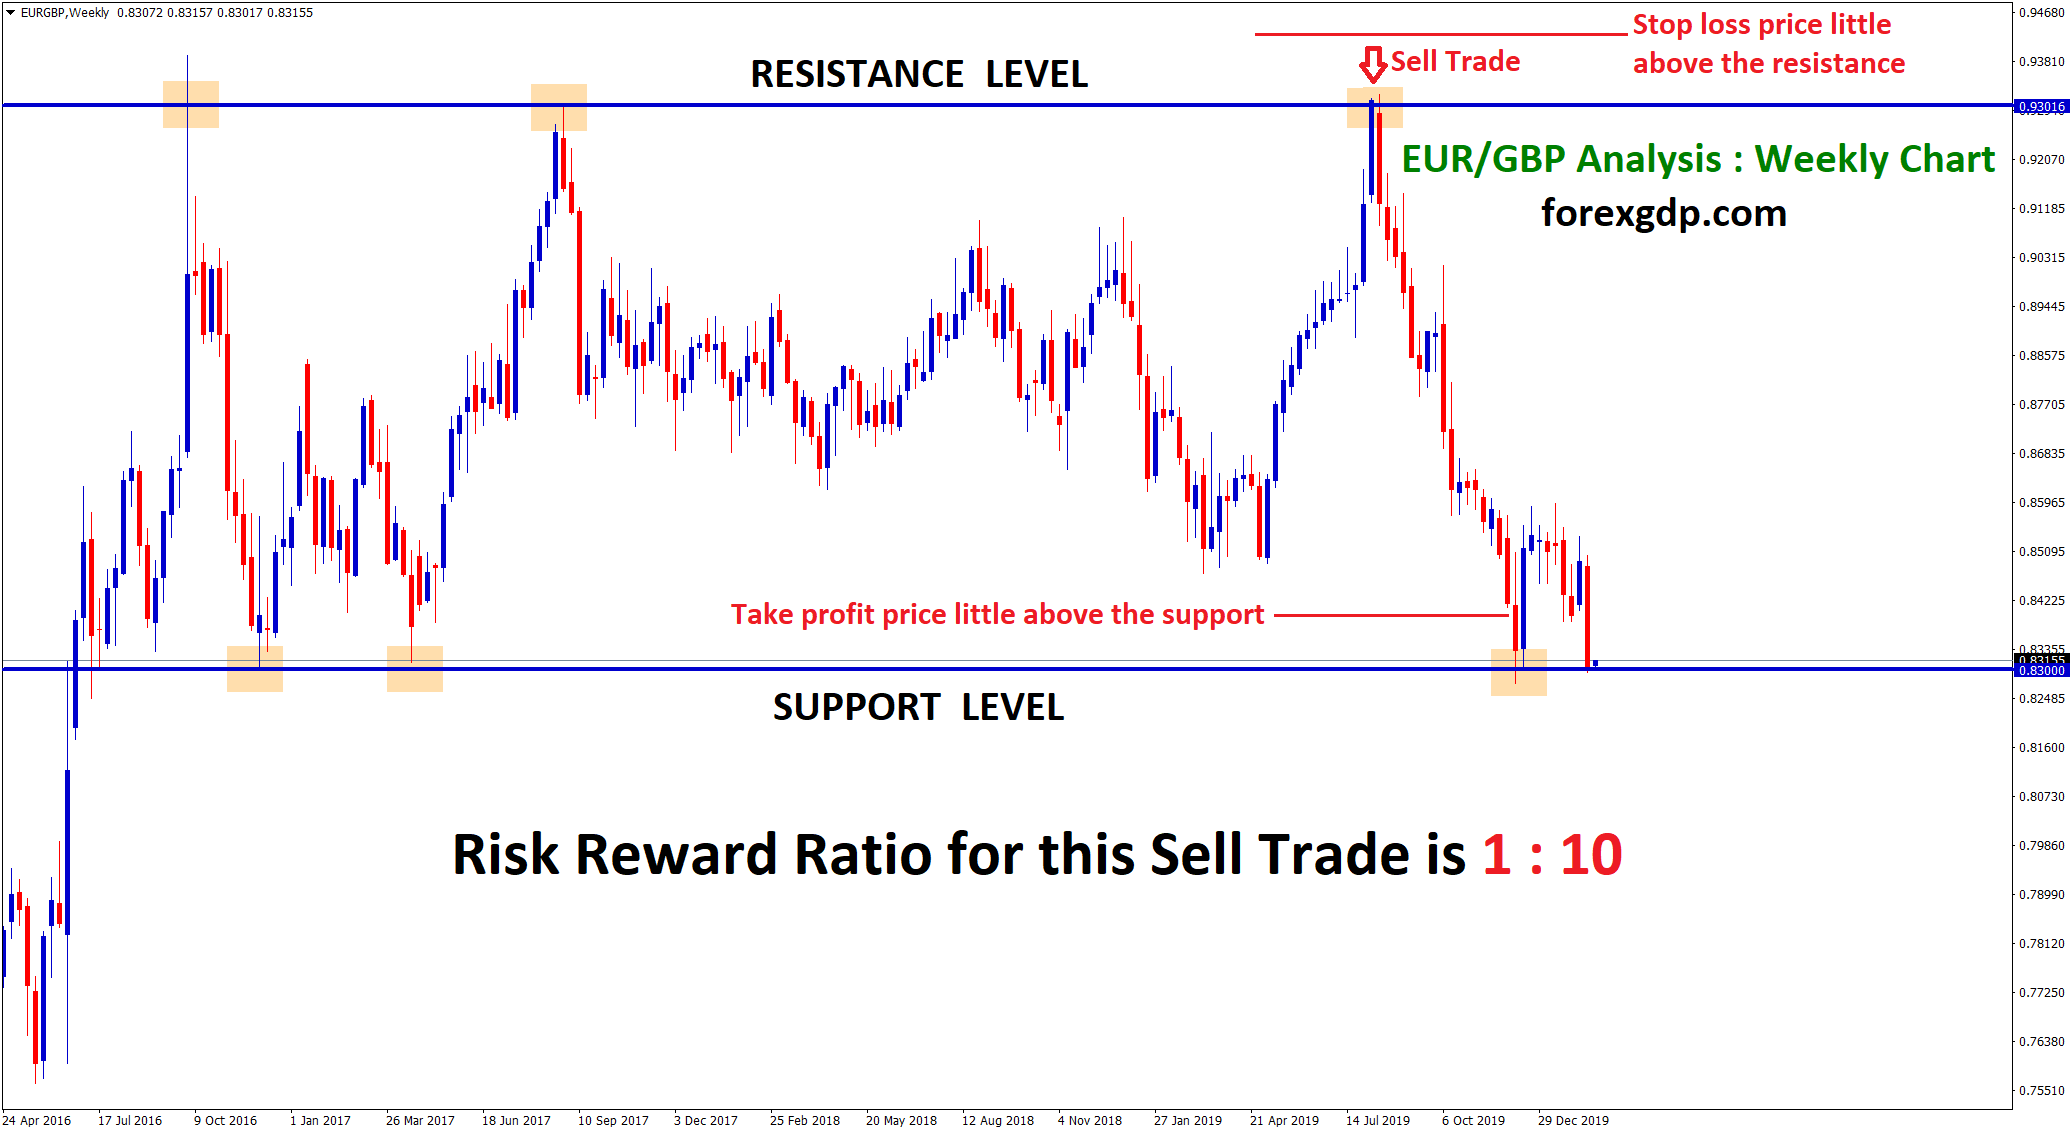
Now, you know how to place the Sell trade at resistance level for making big profits with small risk. It is so easy if you hold your trade with patience until it reaches your take profit target.
How to place buy trade at the support level?
Place Buy Trade at the Support level with small stop loss
And Take profit should be placed just few pips below the resistance level.
Don’t keep the take profit exactly at the resistance line, just set your take profit price few pips below the resistance level.
Why, We don’t want you to keep take profit exactly at the resistance or support line?
The main reason is, Market may not reach your resistance line exactly. but it will come near to your resistance line and reverse back. So, we don’t want you to miss the big profit opportunity in a single trade.
Example Chart :
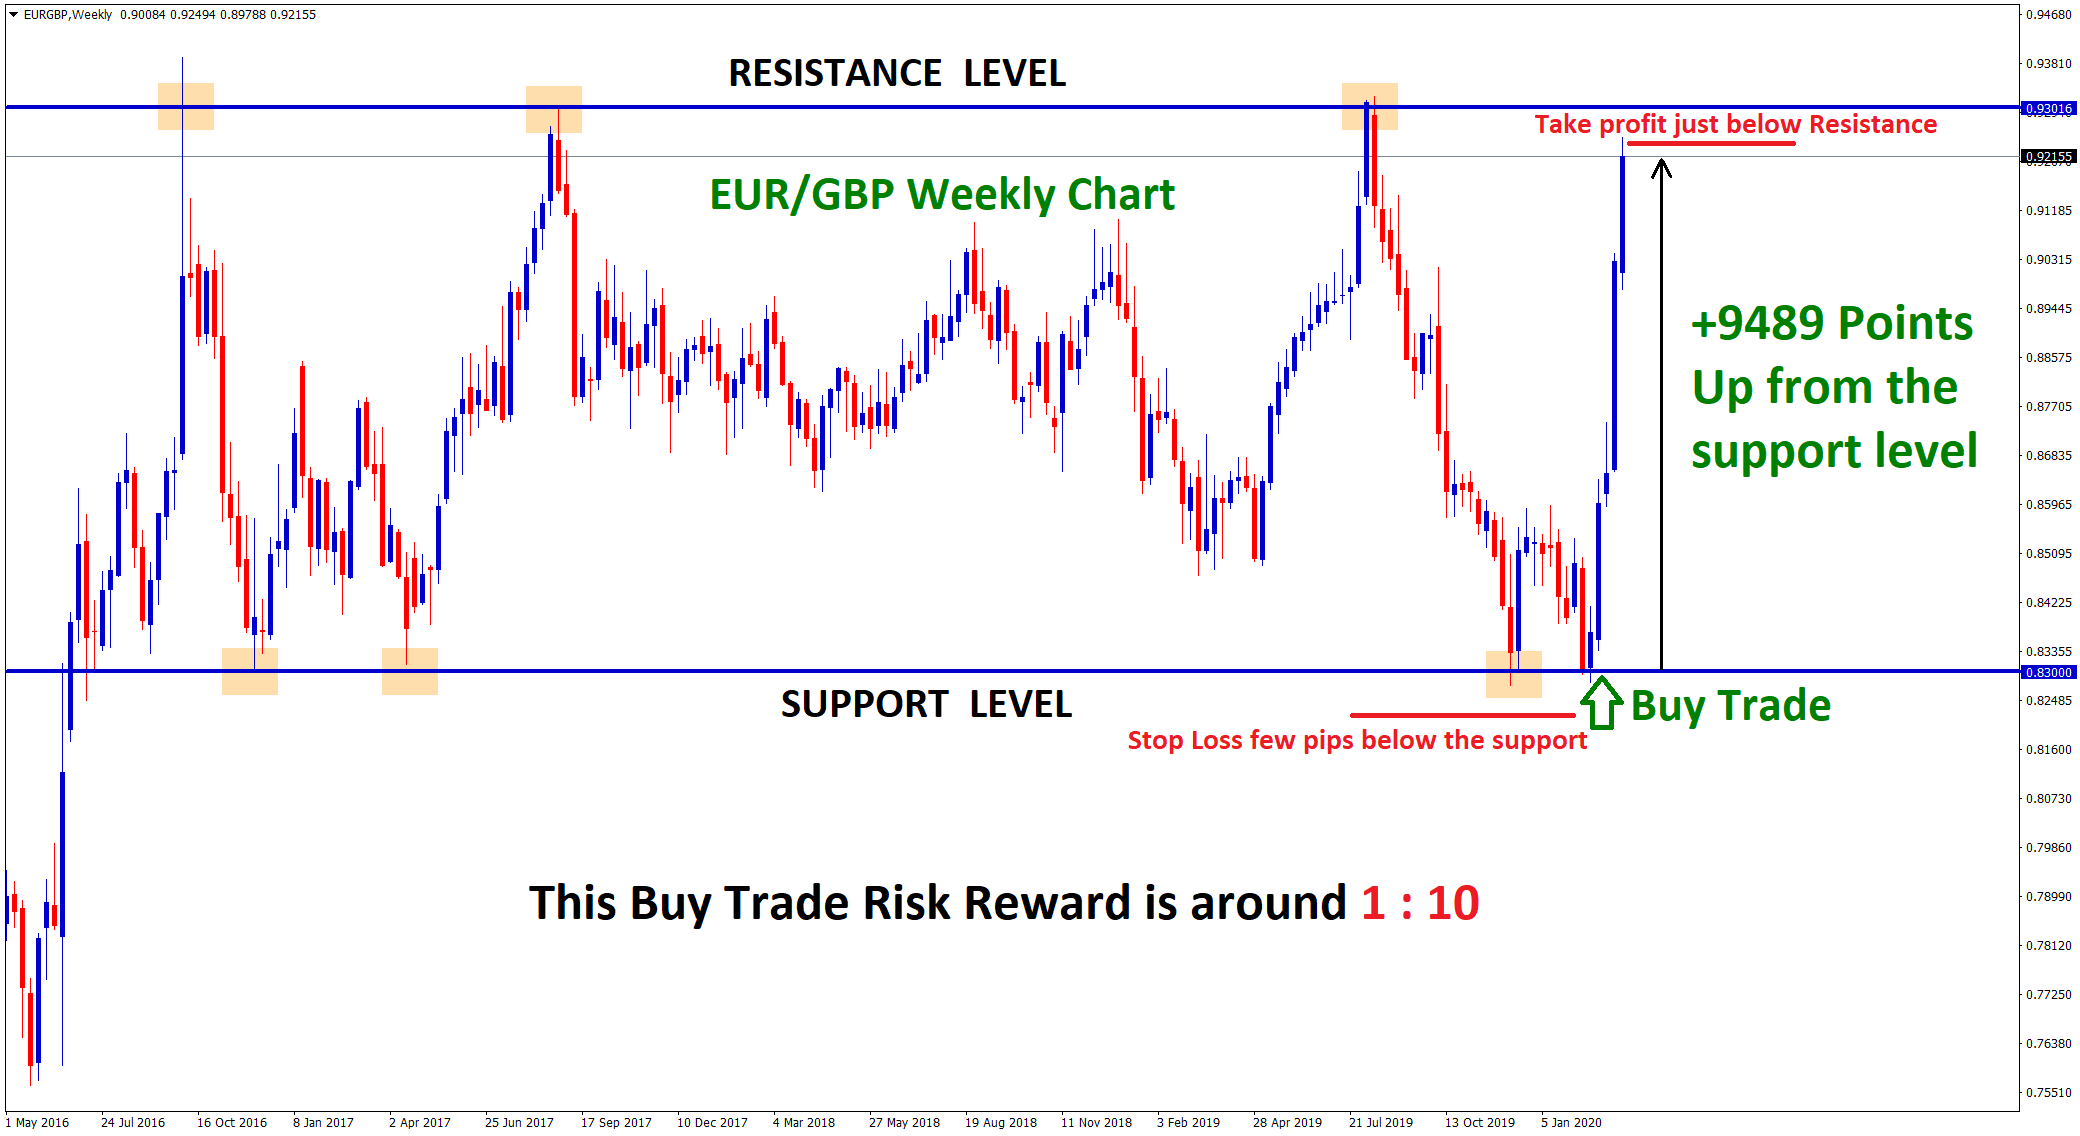
Now, you know how to place the Buy trade at Support level for earning big profits with very small risk.
What happens if market break the resistance or support level?
Good Question!
Now, we going to see how to deal with breakouts in trading?
How to trade, confirm breakouts in trading?
For hourly chart, Wait for 3 continuous bull or bear candles to get closed across the breakout level. 3 hours.
Learn how to trade the breakouts in forex market?
- What is mean by breakout?
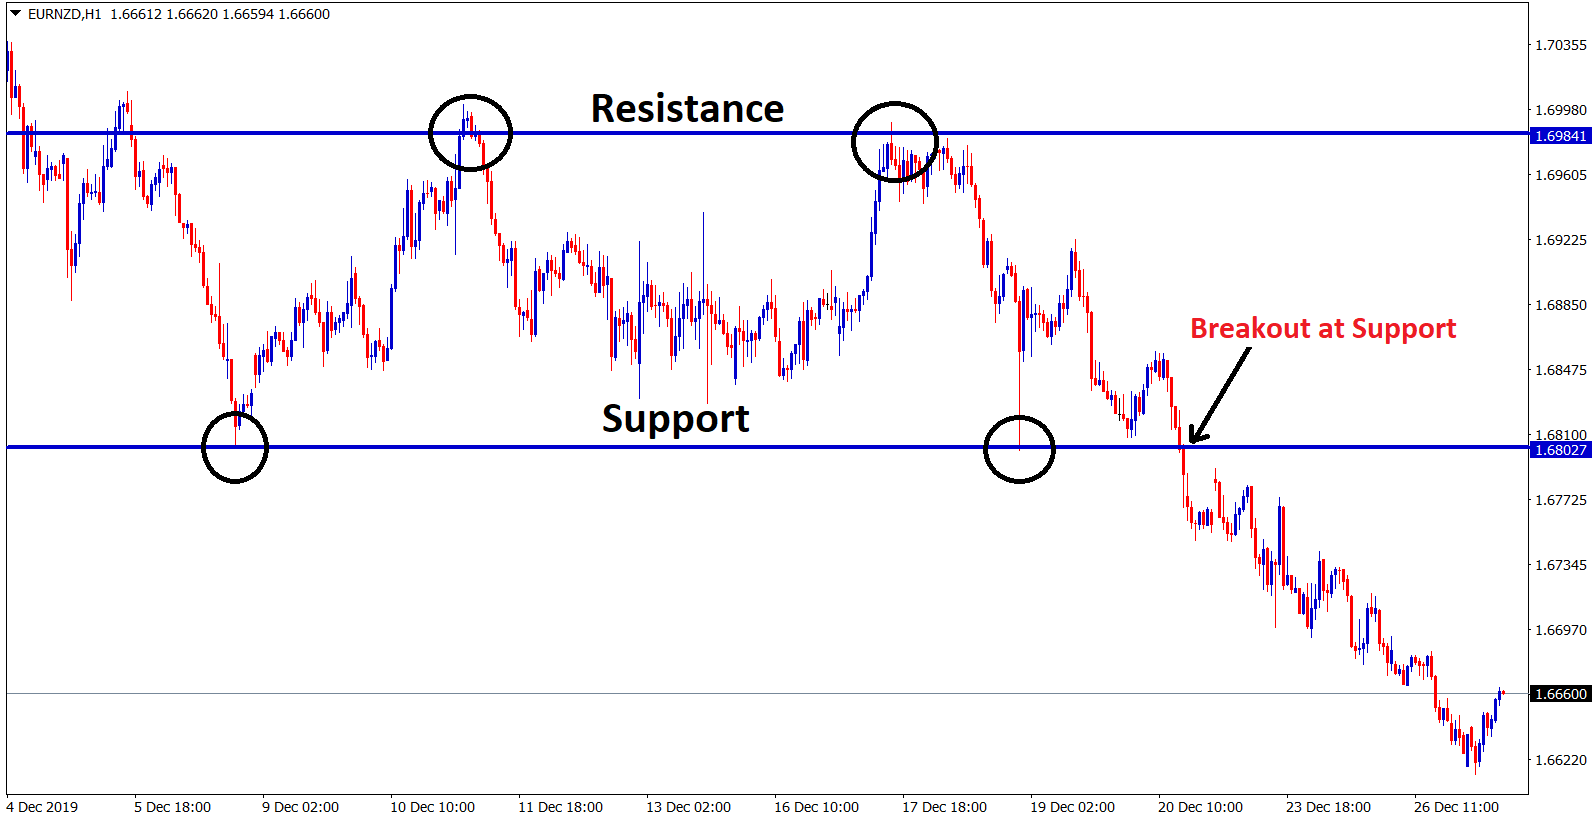
Breakout is the price movement outside a defined support or resistance zone.

- What is mean by Resistance breakout?
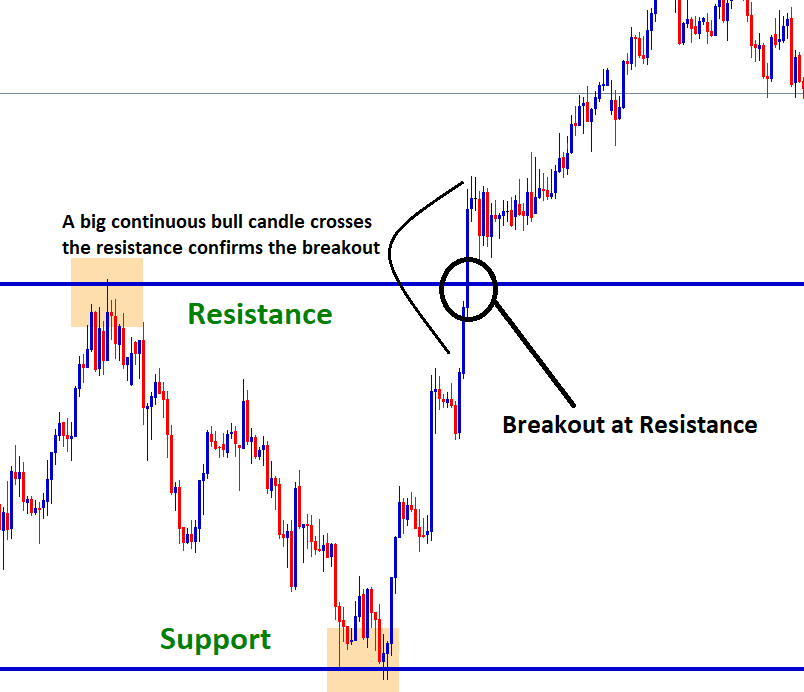
If market breaks the resistance price level with increased volume of buyers with big or continuous bull candles, then it is called as Resistance breakout.

- What is mean by Support breakout?
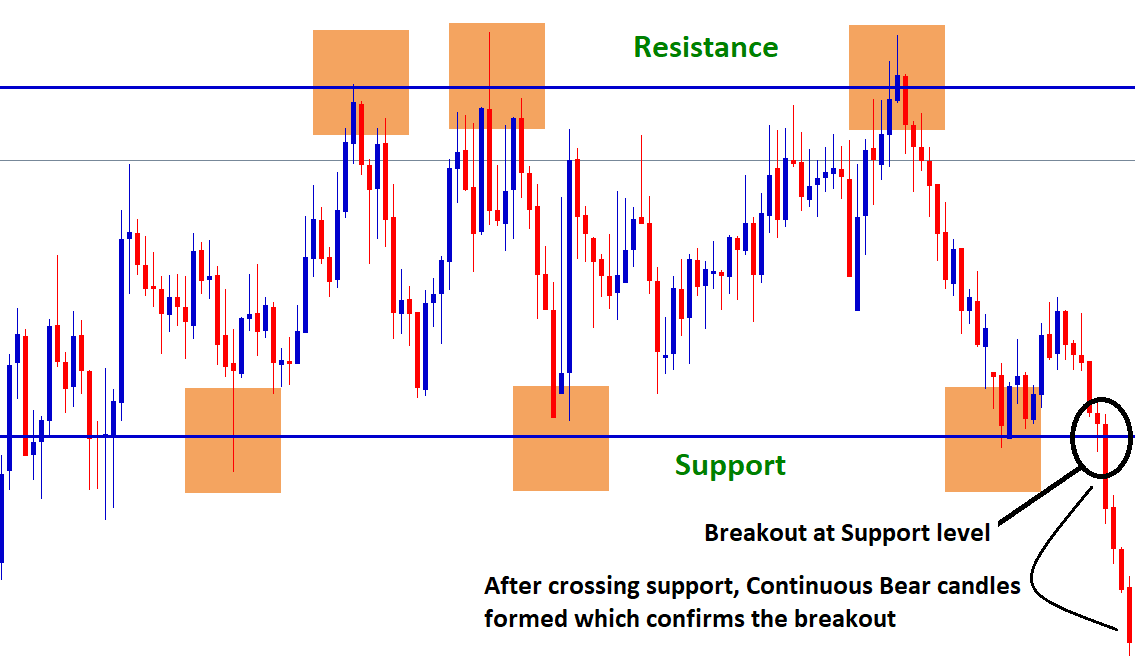
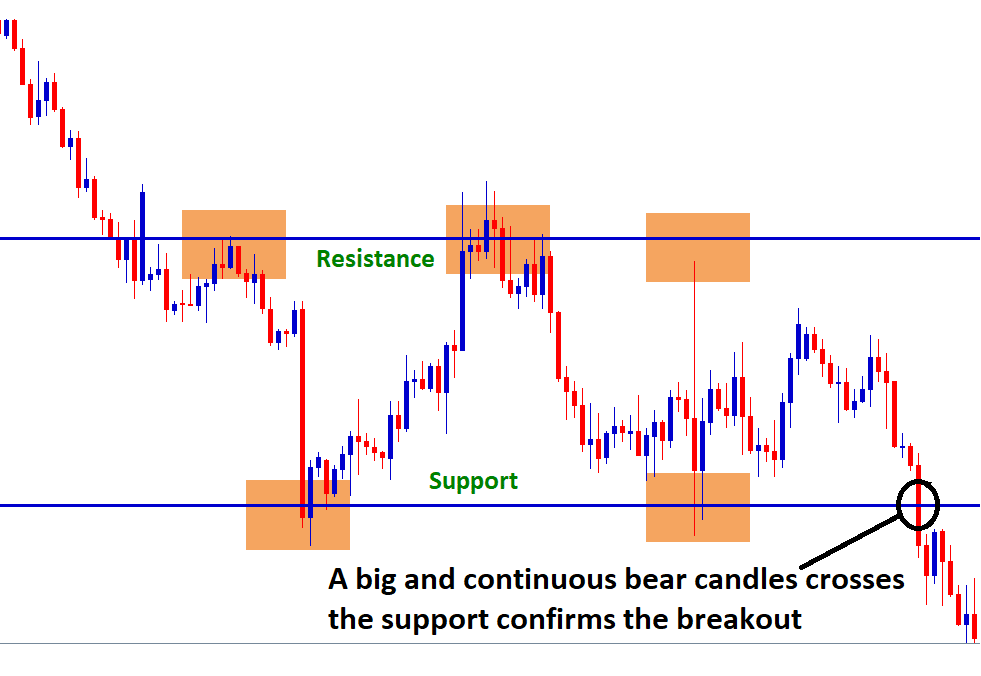
If market breaks the support price level with increased volume of sellers with big or continuous bear candles, then it is called as Support breakout.

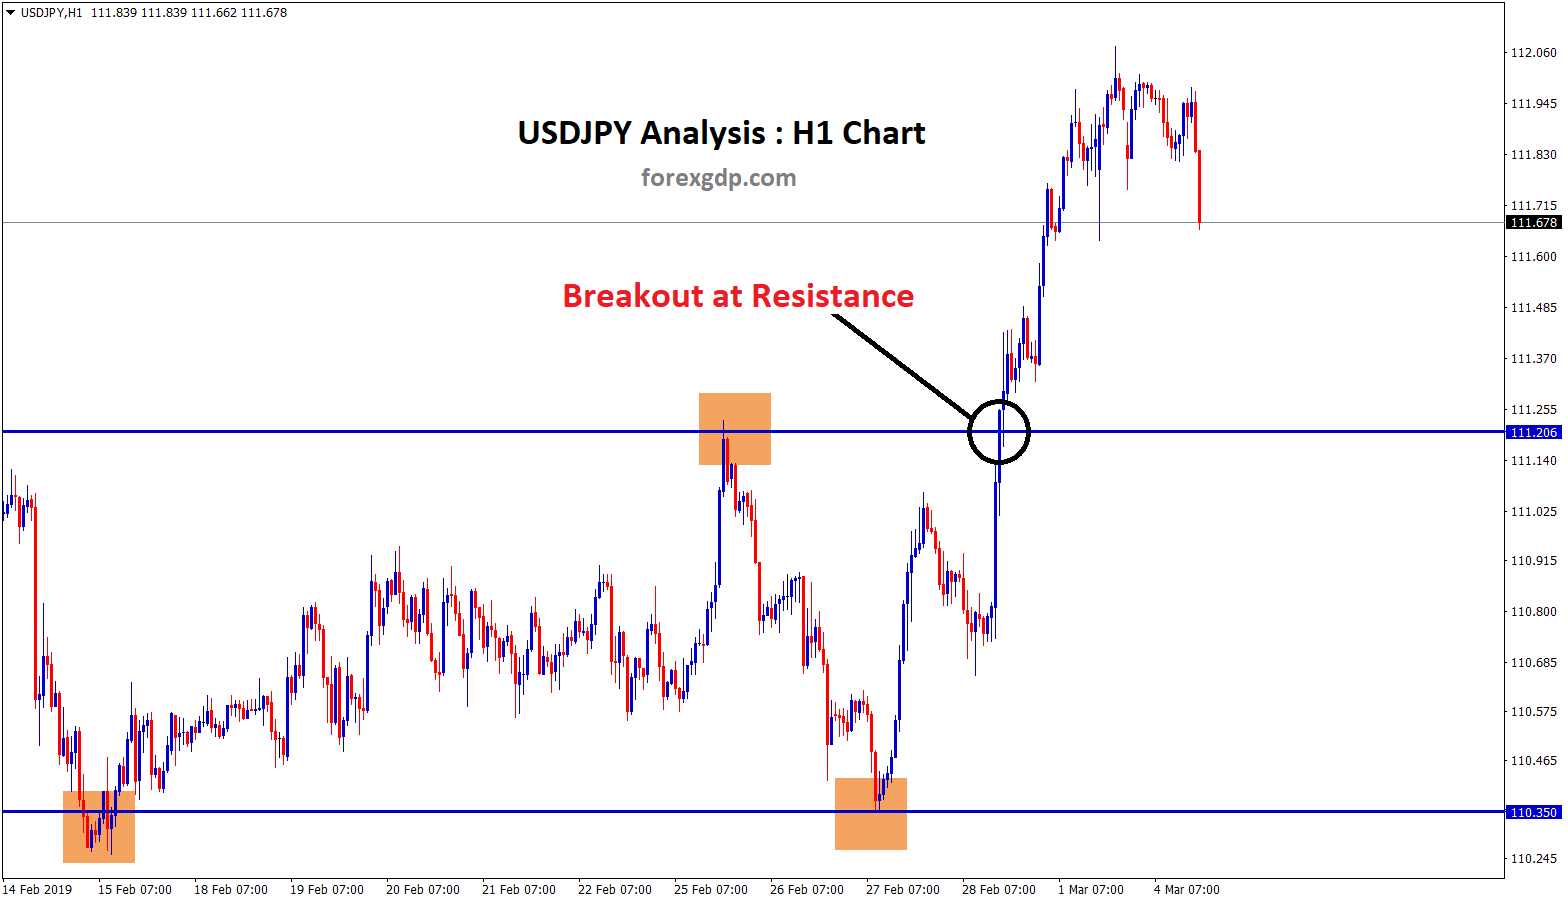
- How to confirm Breakout in trading?
Breakouts are confirmed by continuous bull or bear candle closes over the resistance or support level

- How to confirm Resistance Breakout?
For confirming breakout at resistance level, Watch for this setup:
If market crossed the top of the resistance line and formed continuous big bull candlesticks, then it is considered as a valid breakout at the resistance level.
Reason : Lack of sellers at the resistance level creates some pull back, but the buyers overtake the sellers continuously with bull candles. This is how breakout occurs at the resistance level.
Finally, Bull breakout confirm at the resistance level by this way.
- How to confirm Support Breakout?
If market crossed the bottom of the support line and formed continuous big bear candlesticks, then it is considered as a valid breakout at the support level.
Reason : Lack of Buyers at the support level creates some pull back, but the sellers overtake the buyers continuously with bear candles.
Bear Breakout confirm at the support level by this way.
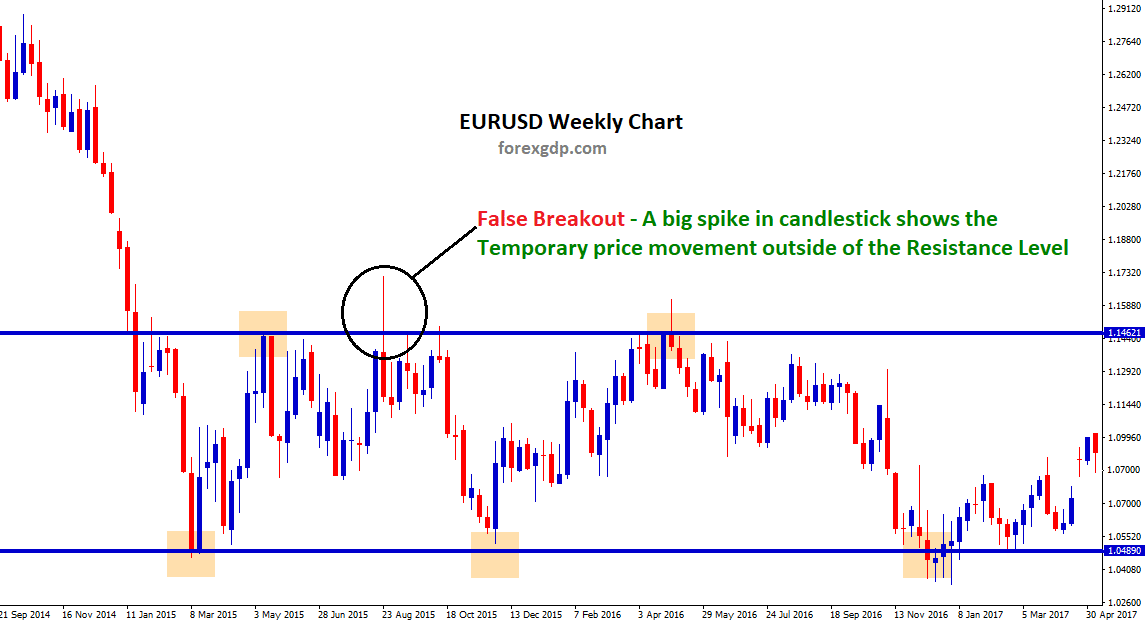
- What is a False breakout in trading?
A false breakout is the temporary price movement across the important resistance or support level. But sooner it reverses back by creating a big spike in candlestick which looks like long wick candlestick. Always use stop loss while dealing with breakout to avoid big losses.

After breakout, how to do Support and Resistance Trading?
After breakout happened at the support and resistance zone, still the market respects the old broken resistance and support levels.
So, How the Old broken Support or resistance level still useful after valid breakout?
The answer is simple.
After market breaking the Resistance level, this broken resistance level will act as a New Support level.
Next, the market will Re-test the breakout level and starts to rise up.
How to Find Reversal in Trading Forex Market?
Let’s see the examples of How Old resistance turns into New Support :
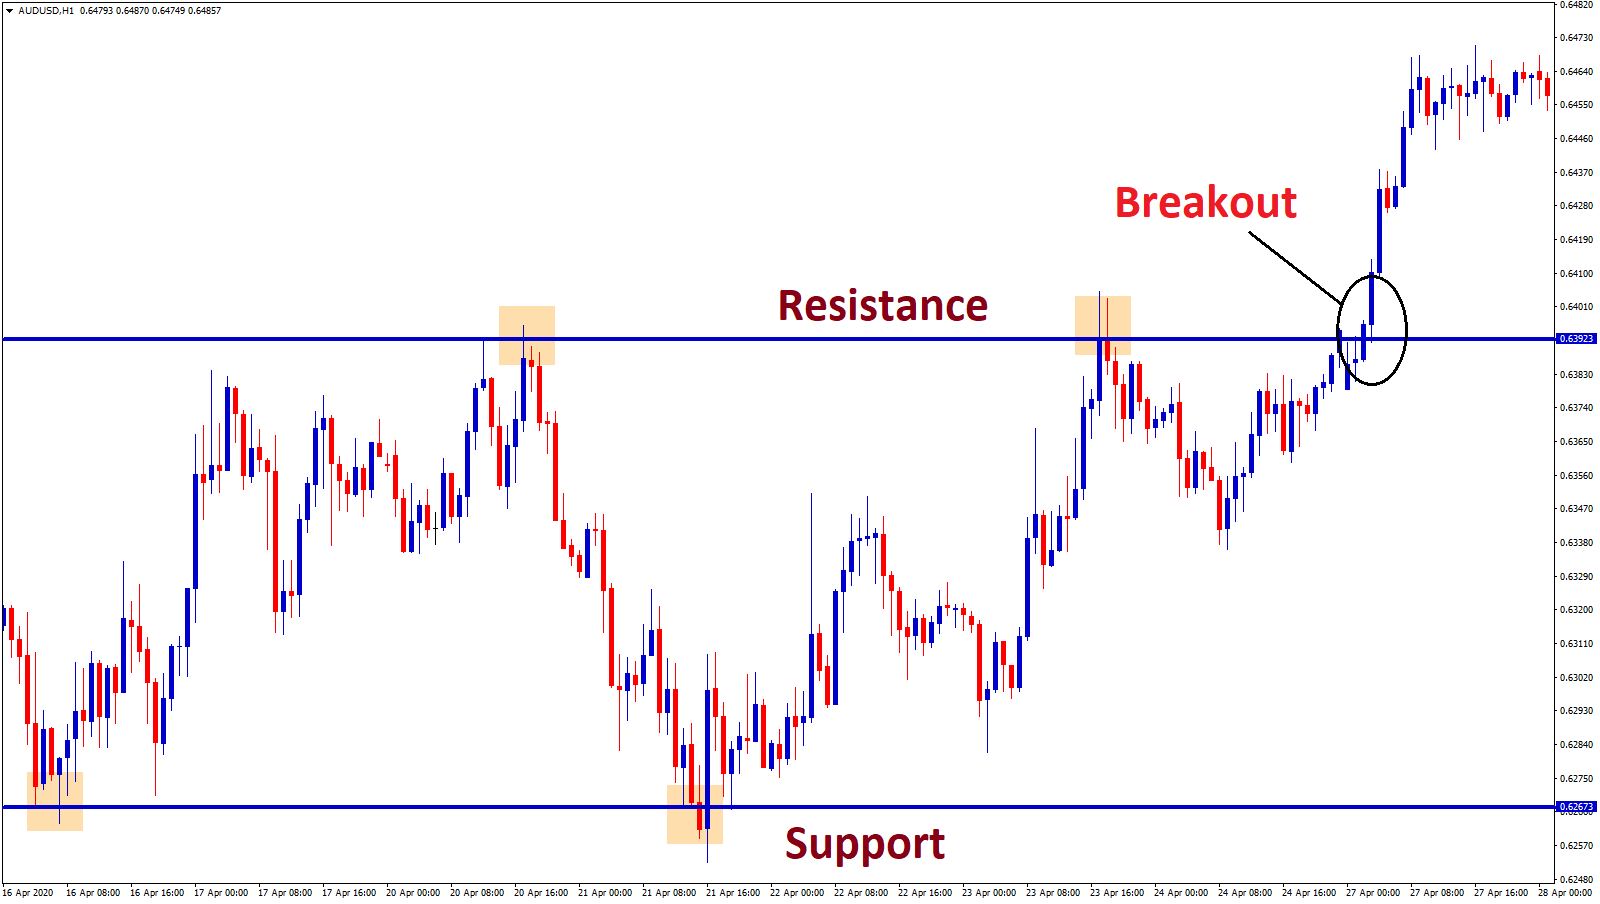
Chart 1 :
In the below AUDUSD chart, first breakout happened at the resistance level.
After breakout, market re-tested the previous breakout level and starts to move up.
The Broken Resistance level simply act as a New Support level in this chart.
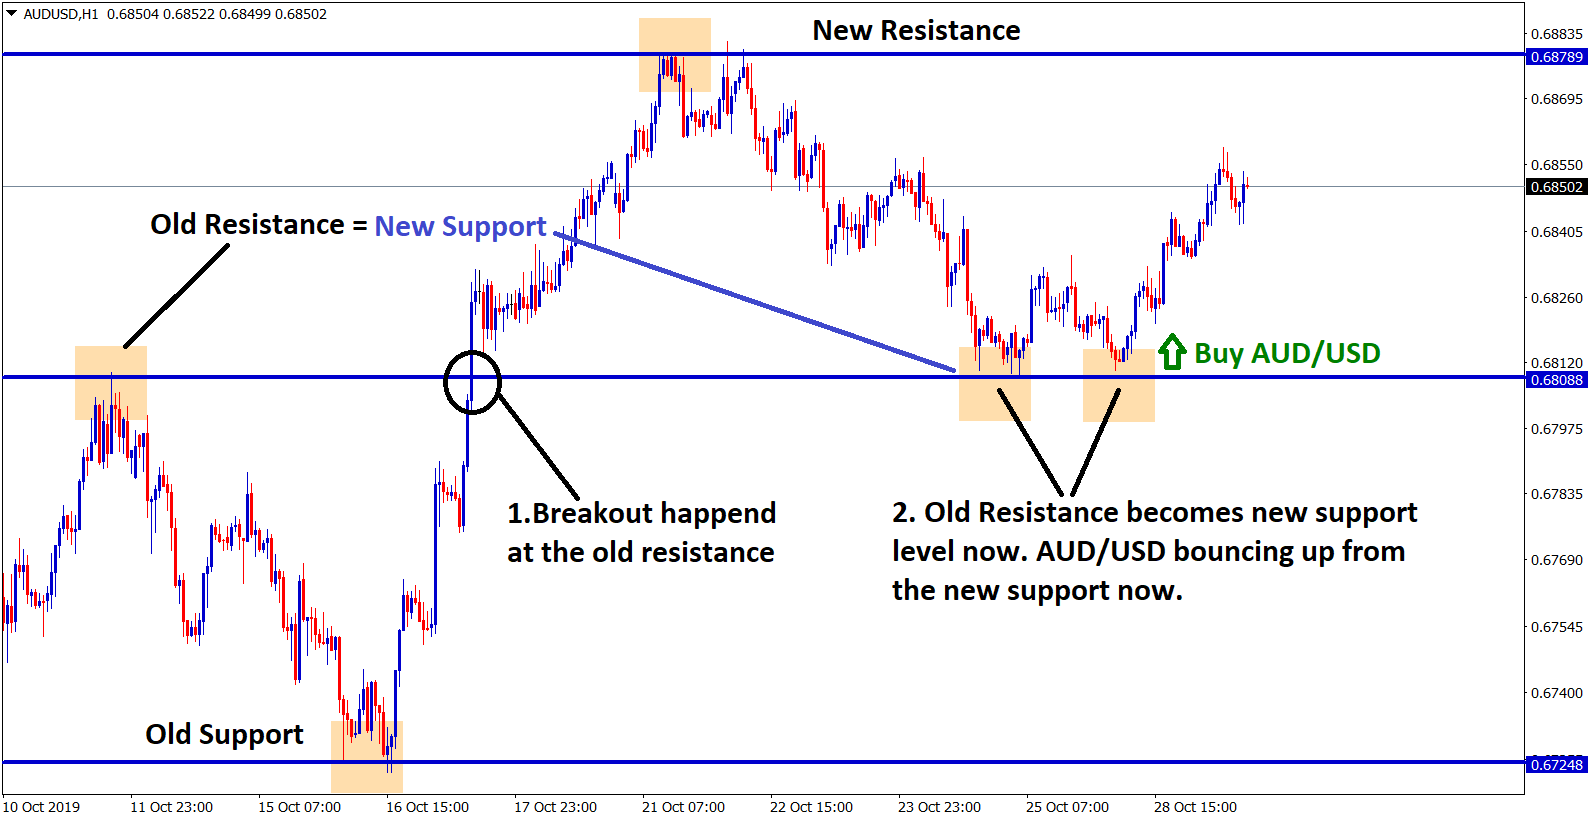
Chart 2 :
See how USDCAD resistance converted into new support after breakout.

Chart 3 :
After breakout, EURGBP resistance converted into New Support
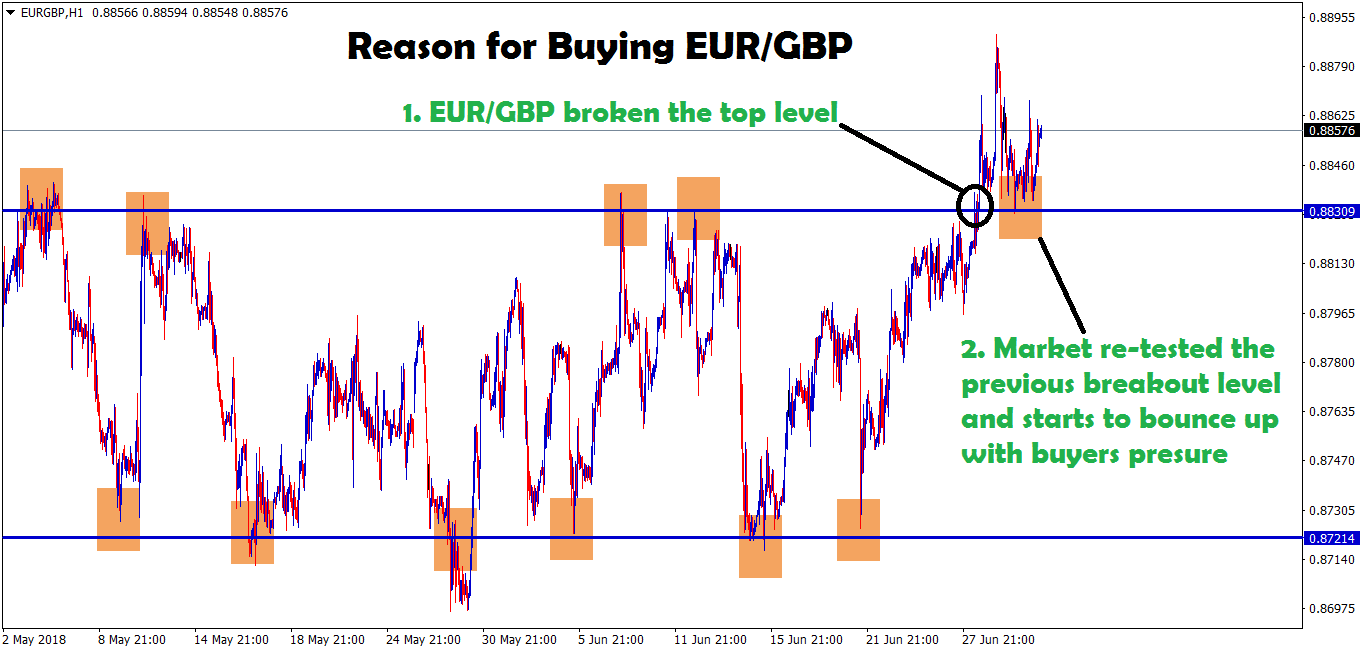
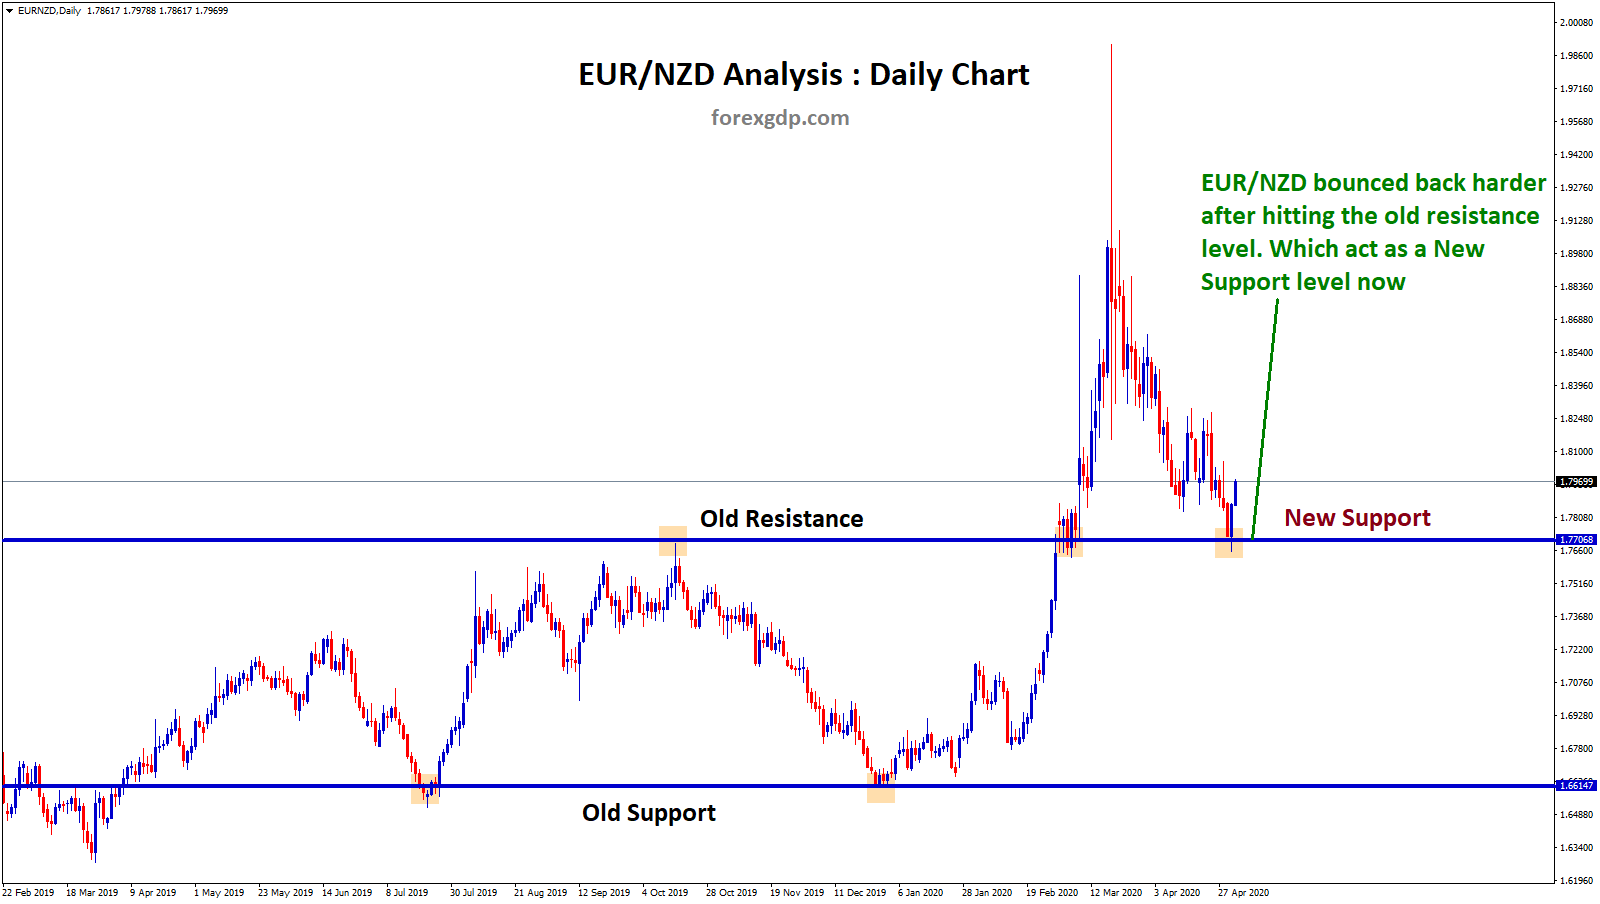
Chart 4 :
EURNZD daily chart still respects the Old resistance level after a long time. This shows that Breakout level is very important.
Similar to Resistance breakout strategy, Support breakout works in the same way.
After market breaking the Support level, this broken support level will act as a new resistance level.
Next, the market will Re-test the breakout level and starts to fall down.
Let’s see some examples of How Old support turns into New resistance:
Chart 1 :
In the below AUDJPY chart, first breakout happened at the support level.
After breakout, market re-tested the previous breakout level and starts to fall down more.
The Broken Support level simply act as a New Resistance level in this chart.
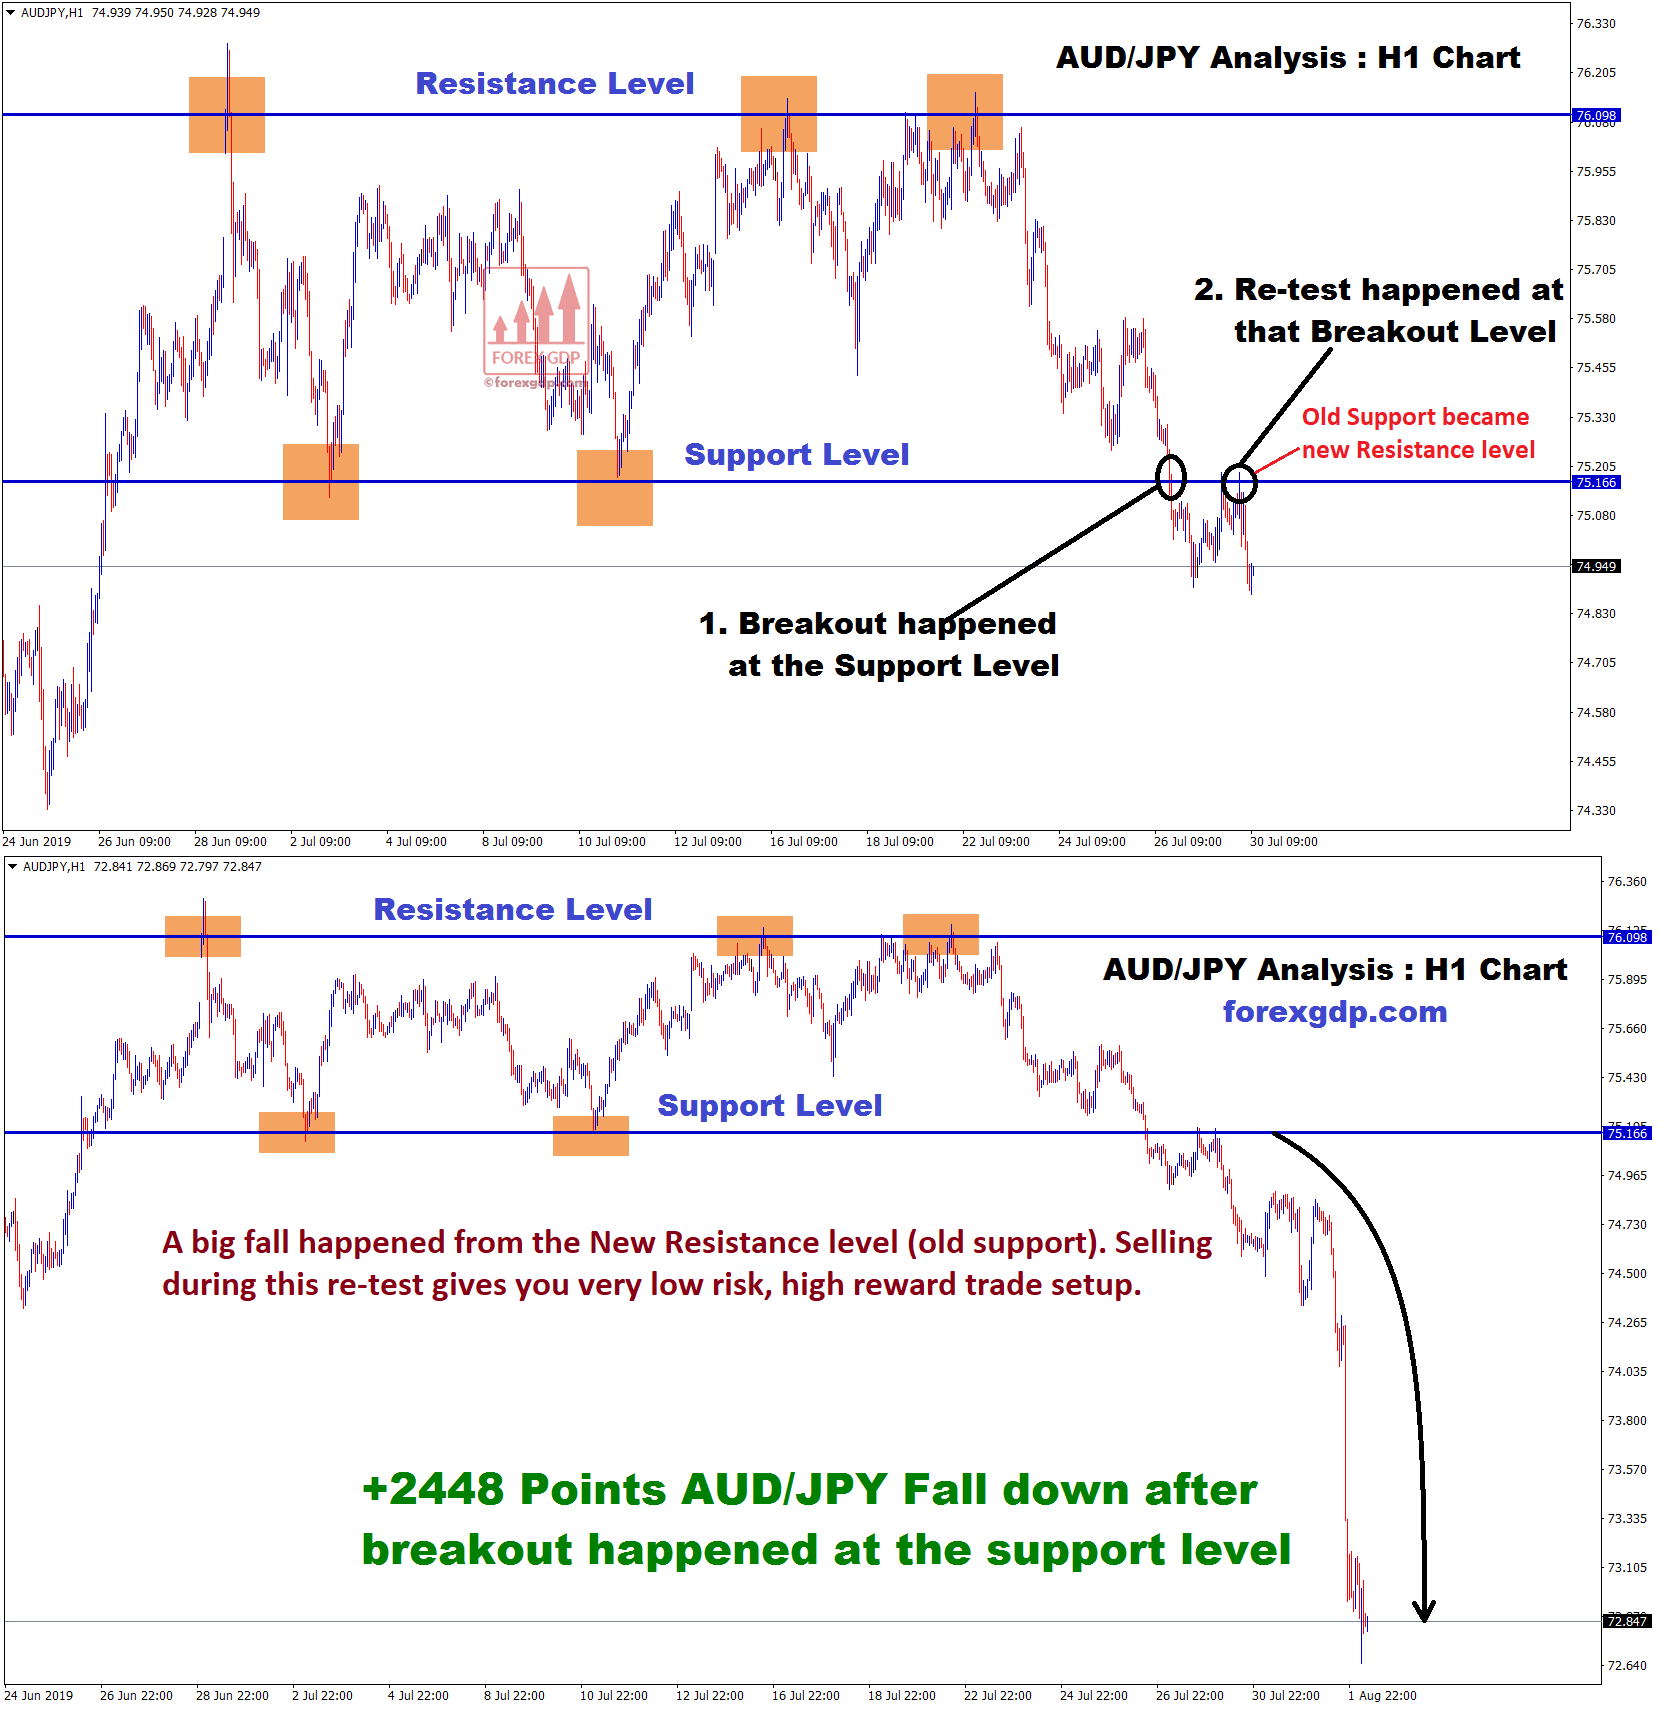
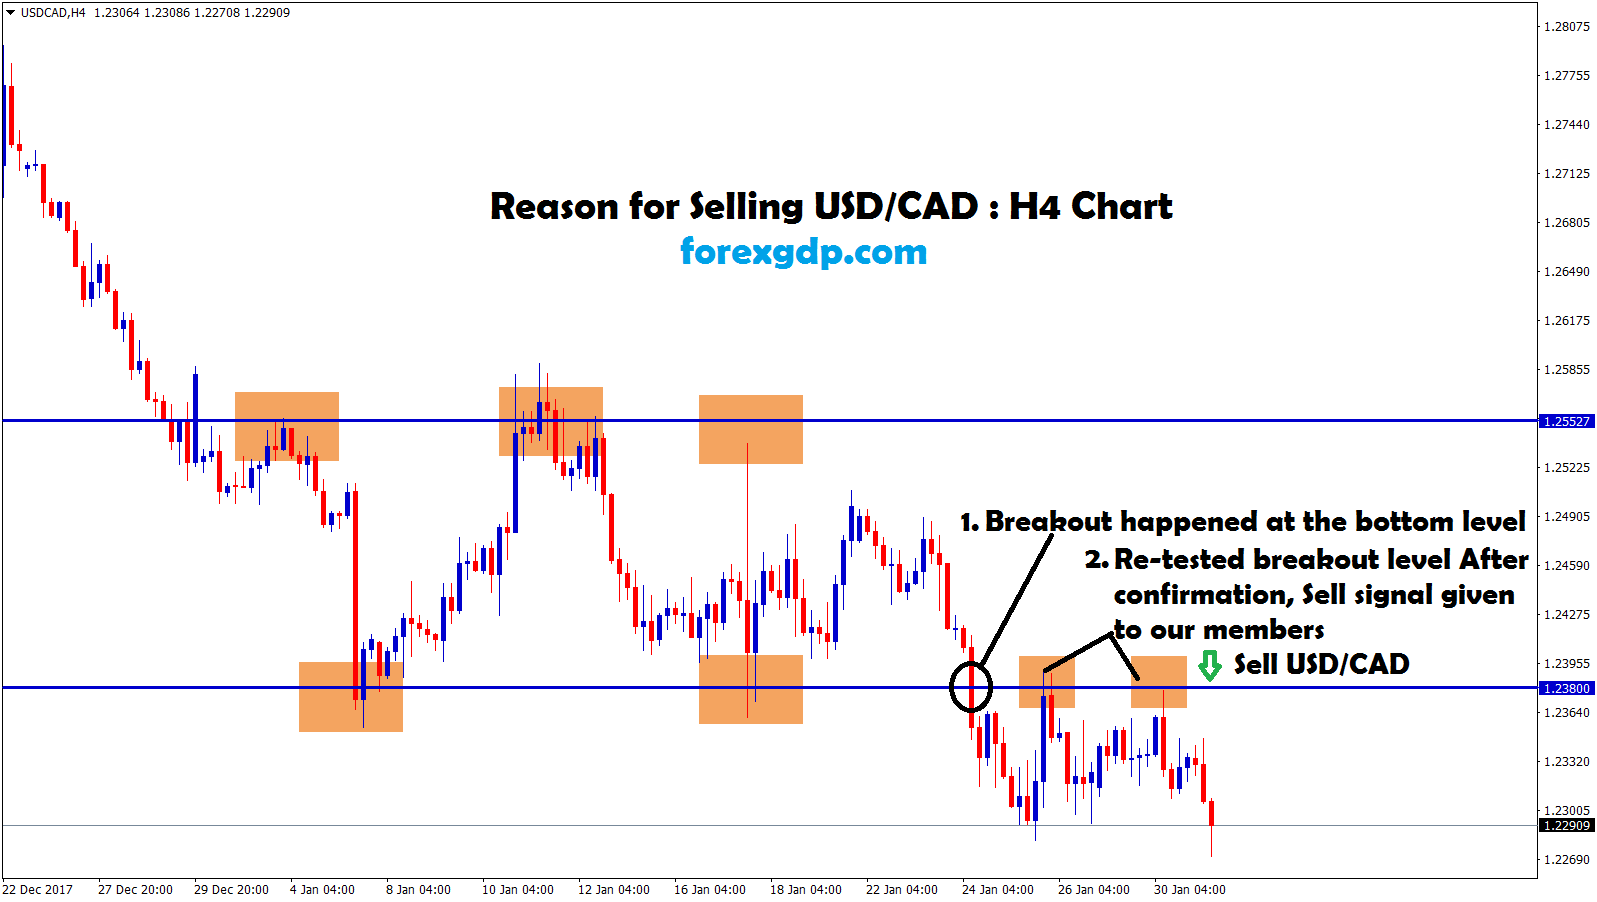
Chart 2 :
Same as above example, This USDCAD broken support level act as a new resistance level.
Why Retest happen after breakout?
A retest in the market refers to price reversing direction after a breakout and market will go for re-touching the breakout level to test whether the breakout level is stronger or weaker.
If the breakout level is weaker, market may enter back into the old resistance and support zones. This is the main reason, you should focus on taking the trades only at the major resistance or support levels.
Major support and resistance level is a stronger level, it is harder to break. But if it breaks, then Resistance turns into Support, Support turns into resistance.
Example : If you look out this chart, Major support level broken at the 3rd attempt after struggling for a long time.
How to identify Major and Minor Support or Resistance Levels?
The Major level is an important level where the market respect more and takes some rest.

But, the Minor level is a thin level where the market break it easier.

Let’s see the example chart, how the forex market reacts to both Minor and Major Support and Resistance levels.
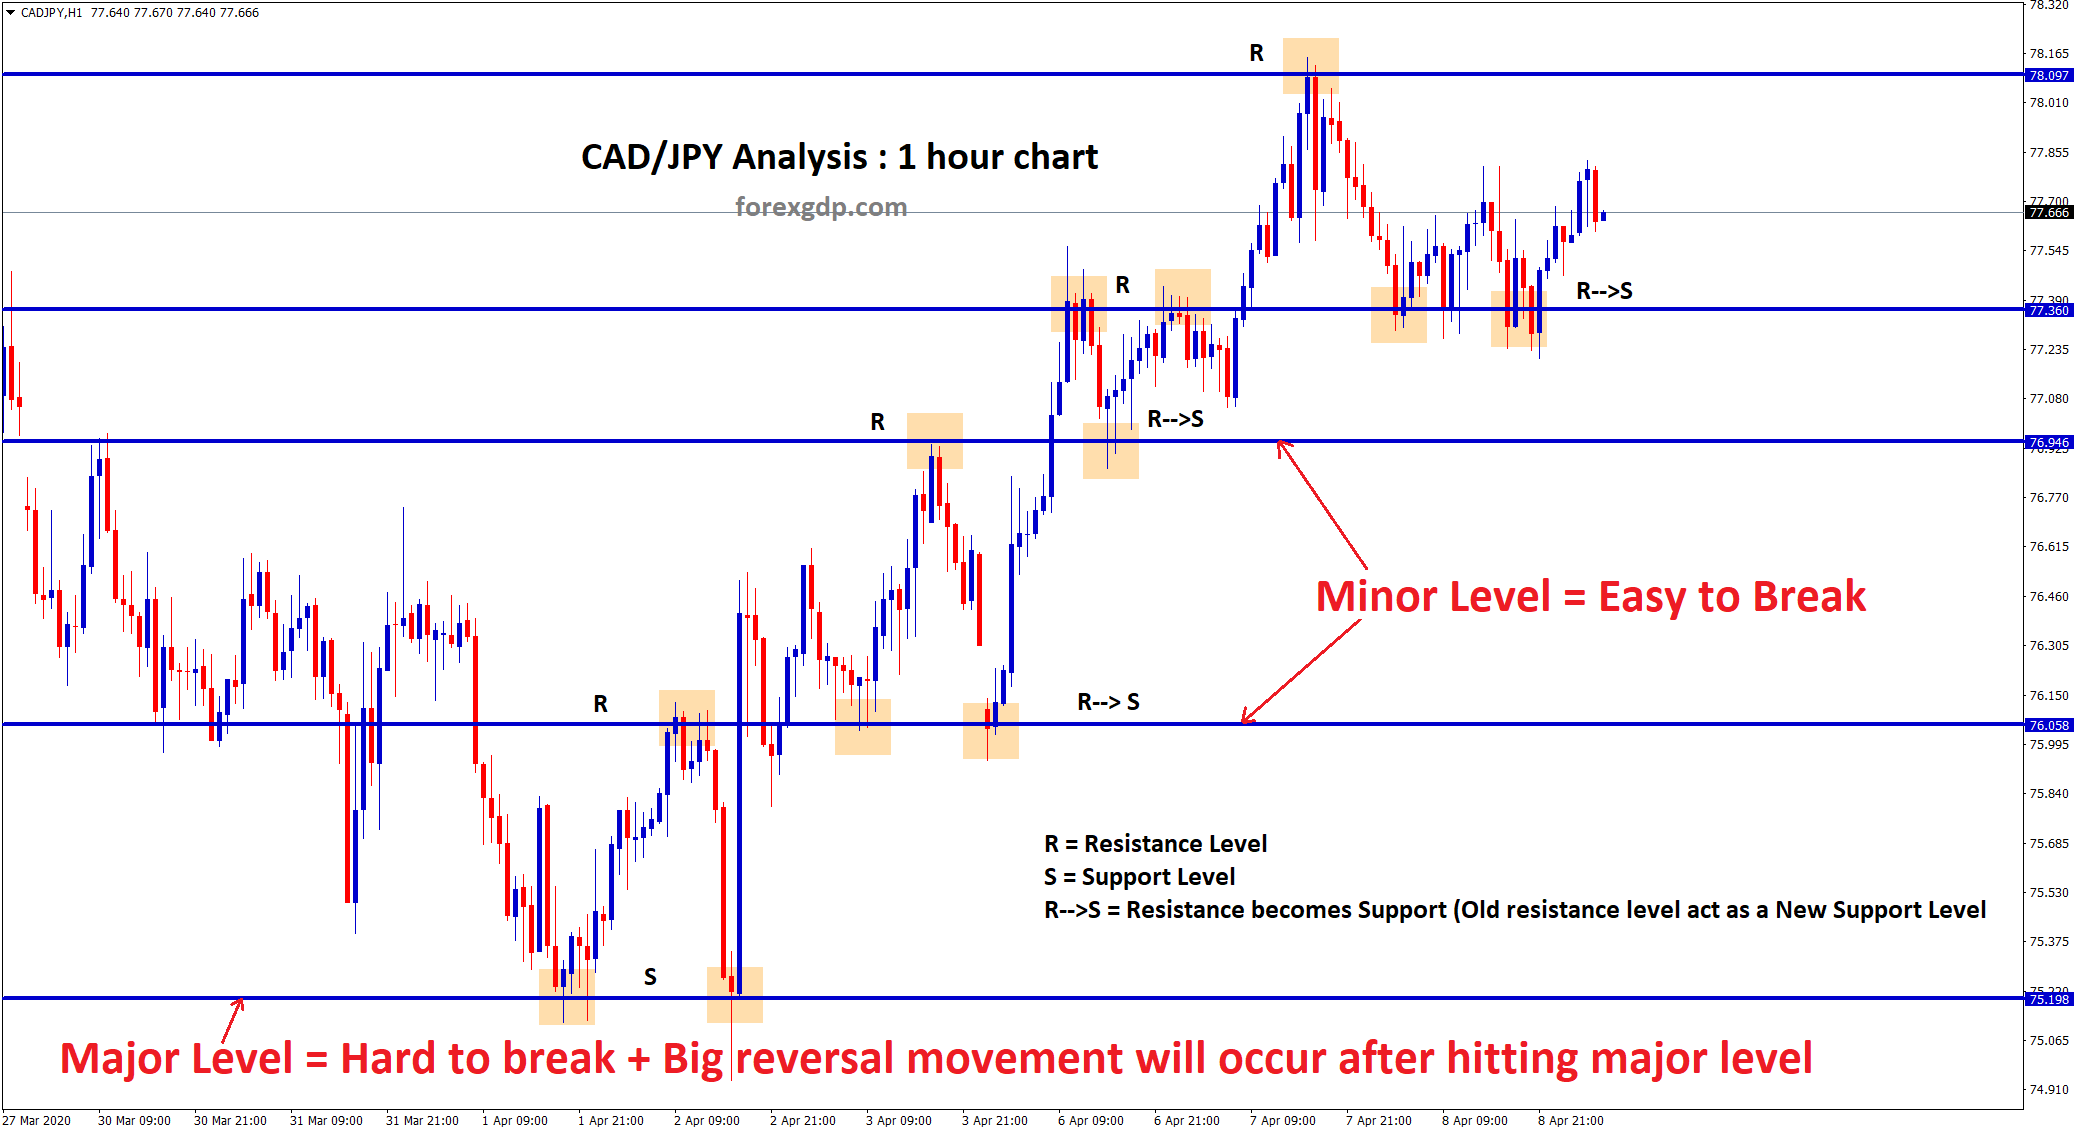
If you look out this CADJPY chart, The major level is difficult to break and whenever market hits the major level, you can see big reversal move.
But, if you look out the minor level, market will respect the level, but it will break the minor level easier and you can see only small reversal after market hitting the minor level.
Minor levels are mostly identified in the smaller time frames such as 30 minutes, 15 minutes, 5 minute chart.
Major levels are mostly identified in larger time frames such as Monthly, Weekly, Daily, 4 hour, 1 hour charts.
In this CADJPY chart, you can see, how the Resistance and Support level are changing after breakout.
After market breaking the resistance, This broken resistance will become new support and the New highs formed after the breakout will be considered as a New Resistance.
Similarly after market breaking the support, this broken support will become new resistance and the New Lows formed after the breakout will be considered as a New support.
This is how the major and minor levels of support and resistance works in the forex market.
Should you trade the breakout or wait for a retest?

After breakout happened at the major Support or Resistance level, If you want to take very low risk, high reward trade, then it is always good to wait for re-test.
The traders who want to take risk, may enter into the trade immediately after the confirmation of breakout.
However, the professional traders who wants to take the trade with SMALL RISK, BIG PROFIT, they wait for re-test and takes the trade.
Check live Free forex signals now.
To increase your trading profits, read this below topics:
How to trade profitably using Chart Patterns?
Low risk, High reward trading strategies
How to get rich trading forex market?
Most predictable Currency Markets
If you want to learn more successful trading techniques with free mentorship support, you can purchase the forex trading video course.
Thank you.