CADJPY forex analysis in different timeframe
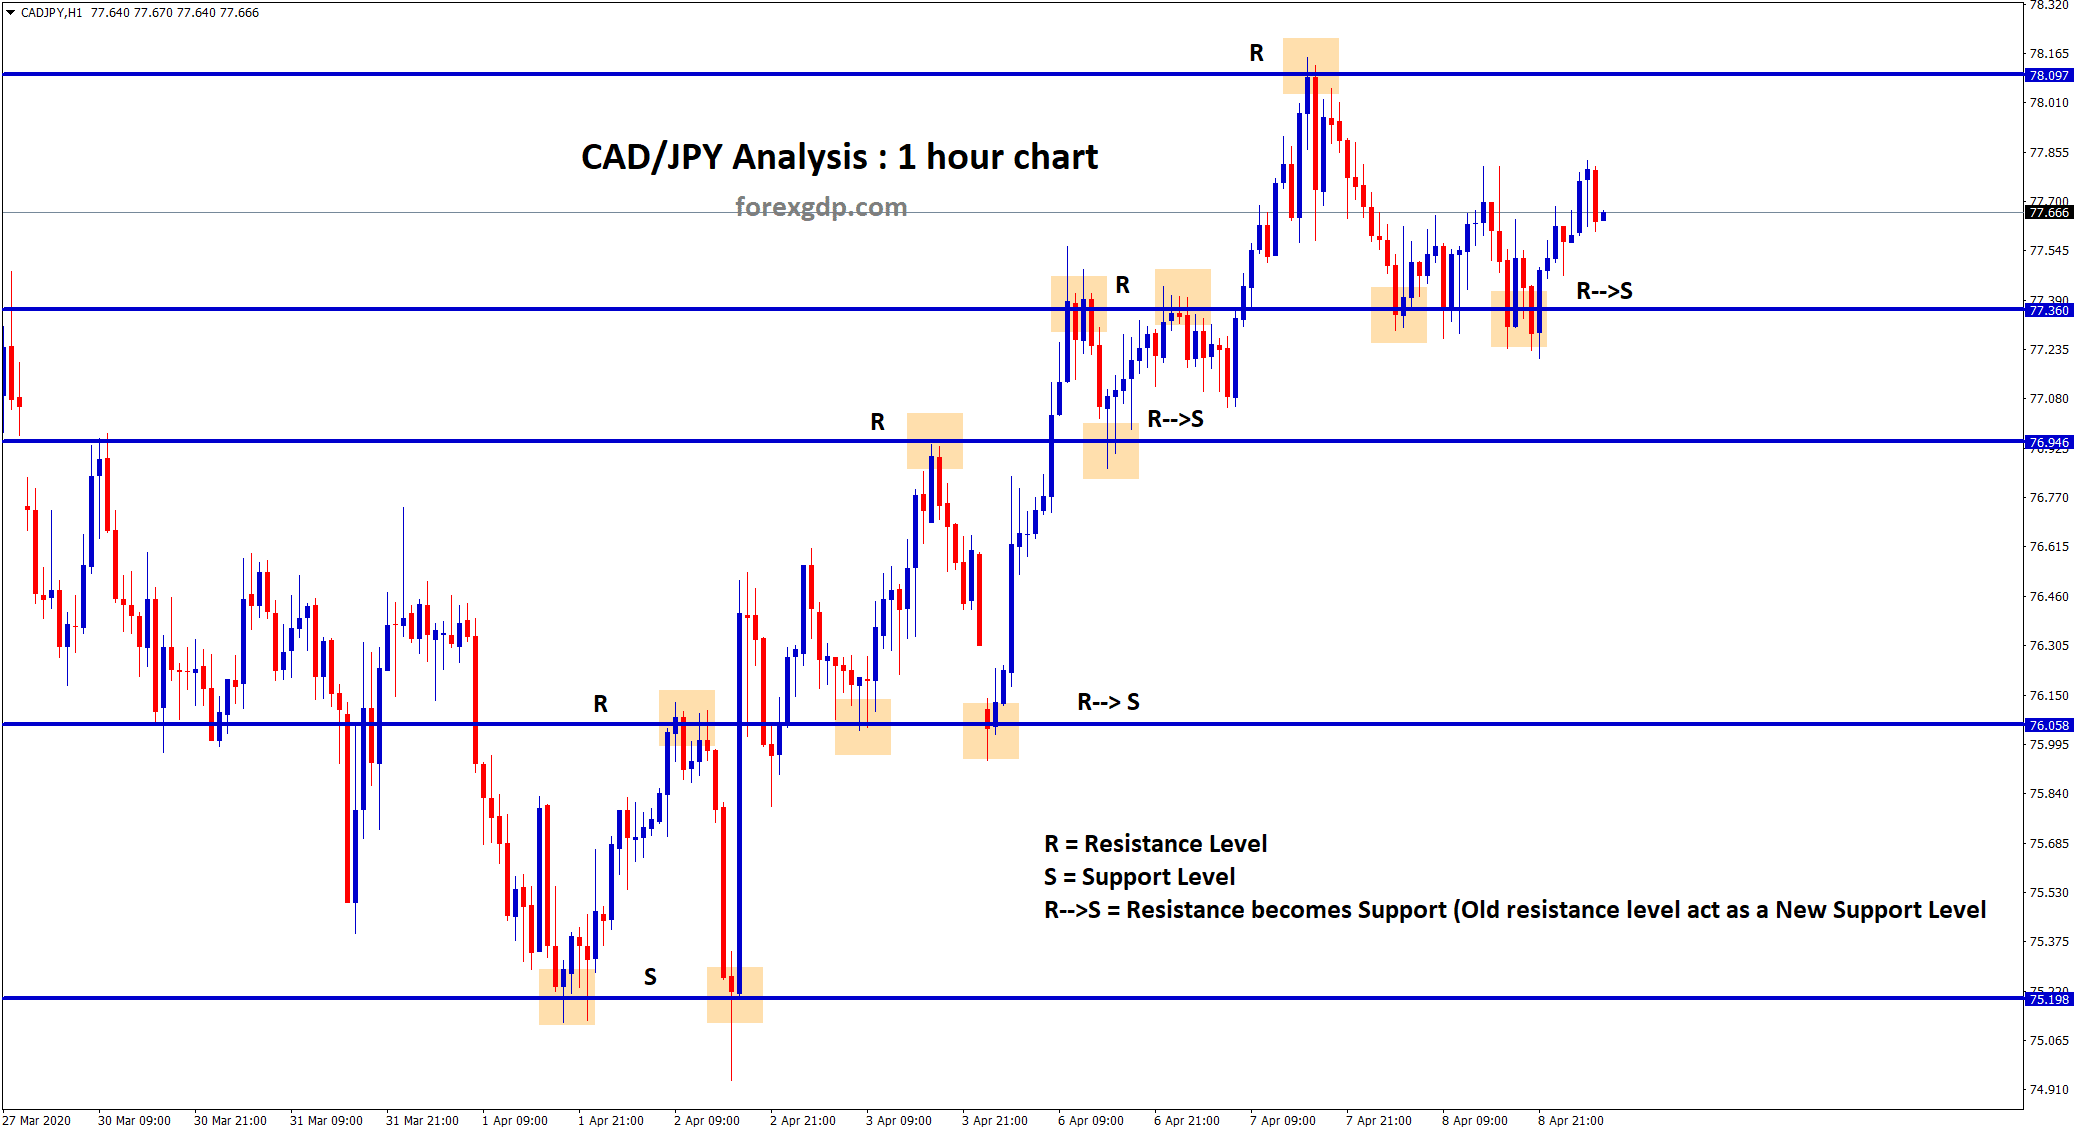
CADJPY moving up and down by making sideways movement between the resistance and support level for long time as shown above.
The old resistance level becomes new support level. This is repeating again and again on this CADJPY chart.
CADJPY moved in an Uptrend by forming higher highs, higher lows in 30 minutes chart. But the downward movement is not confirmed.
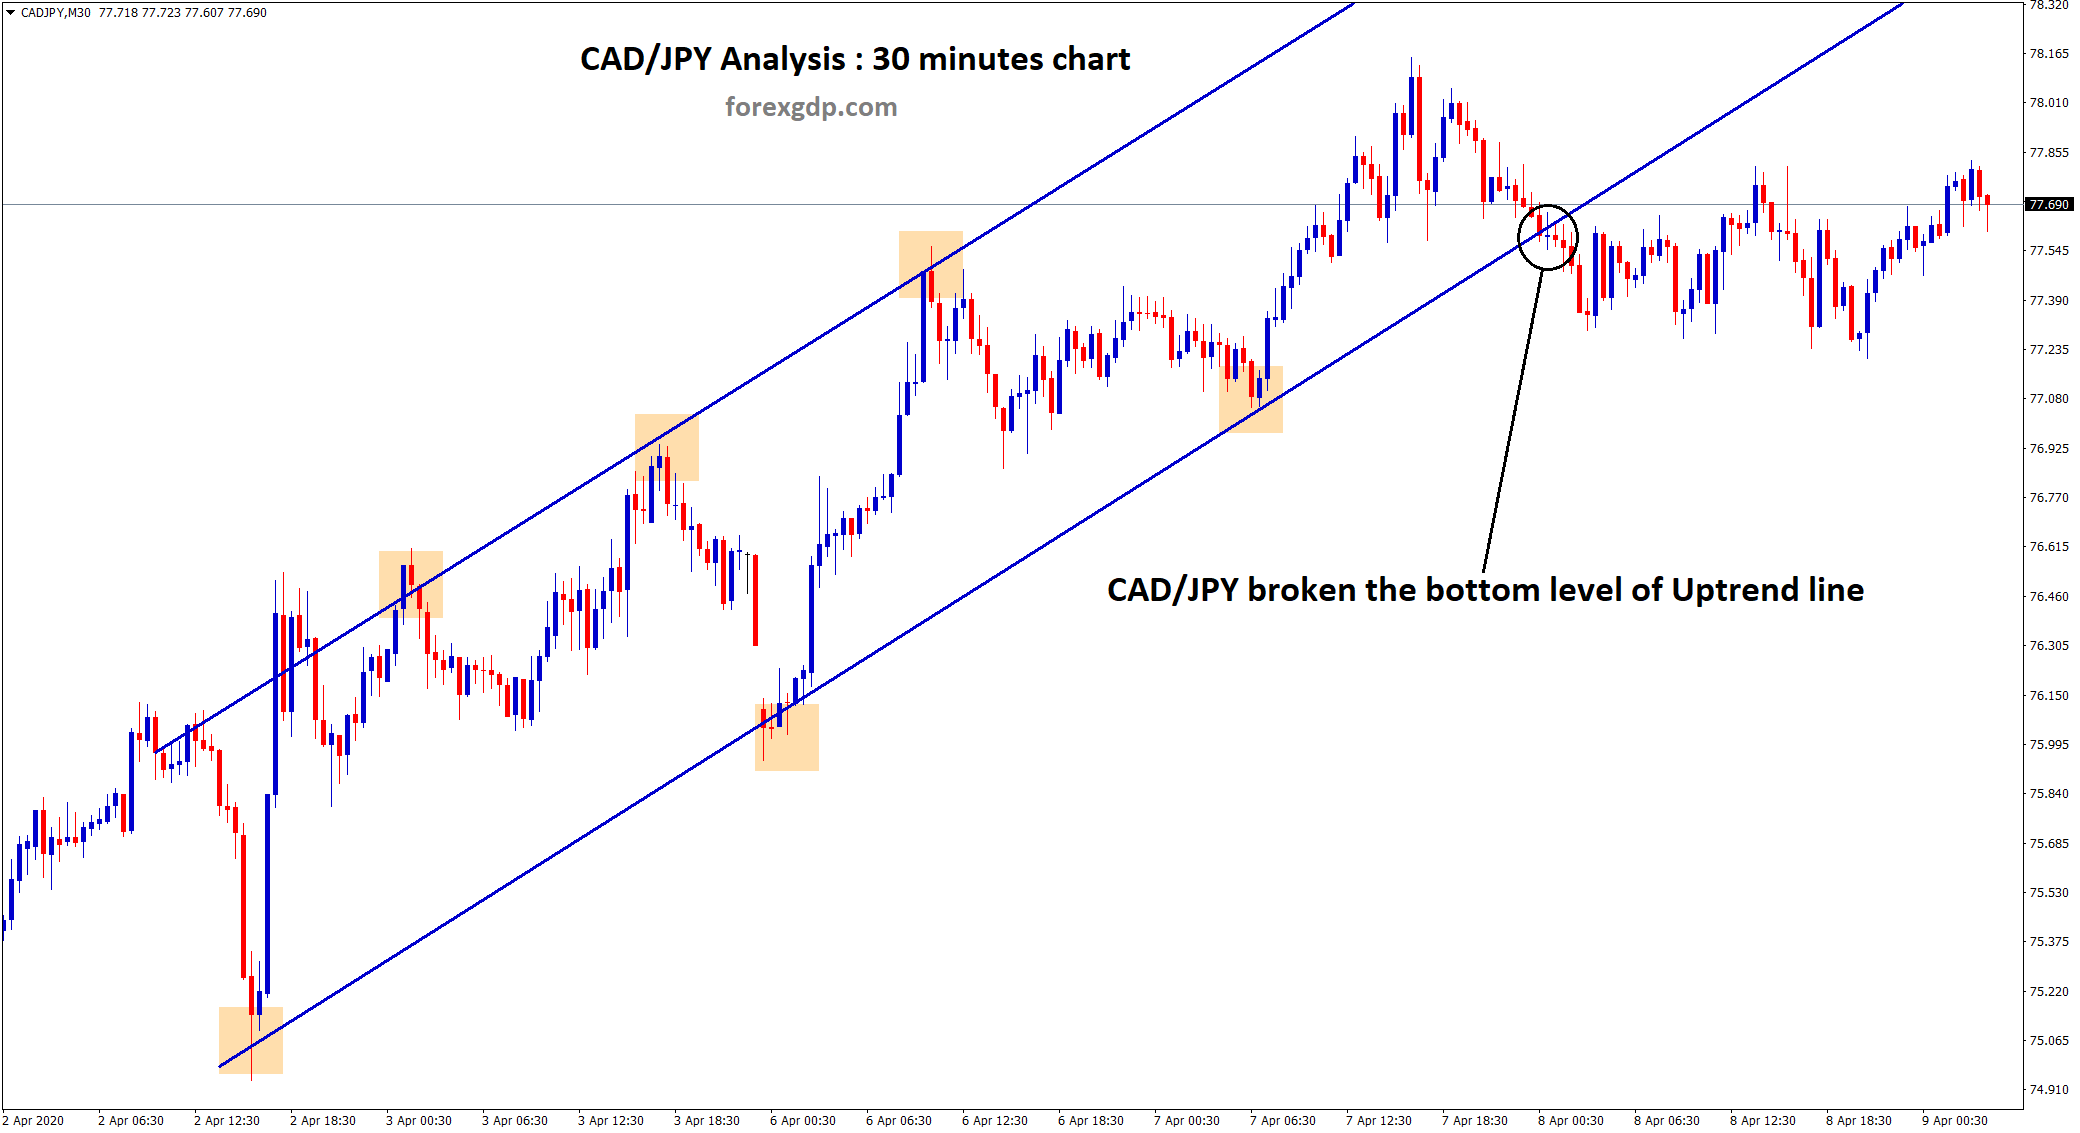
Same as USD/JPY Analysis, CADJPY broken the bottom level of the Uptrend line and starts to move in a sideways for long time.
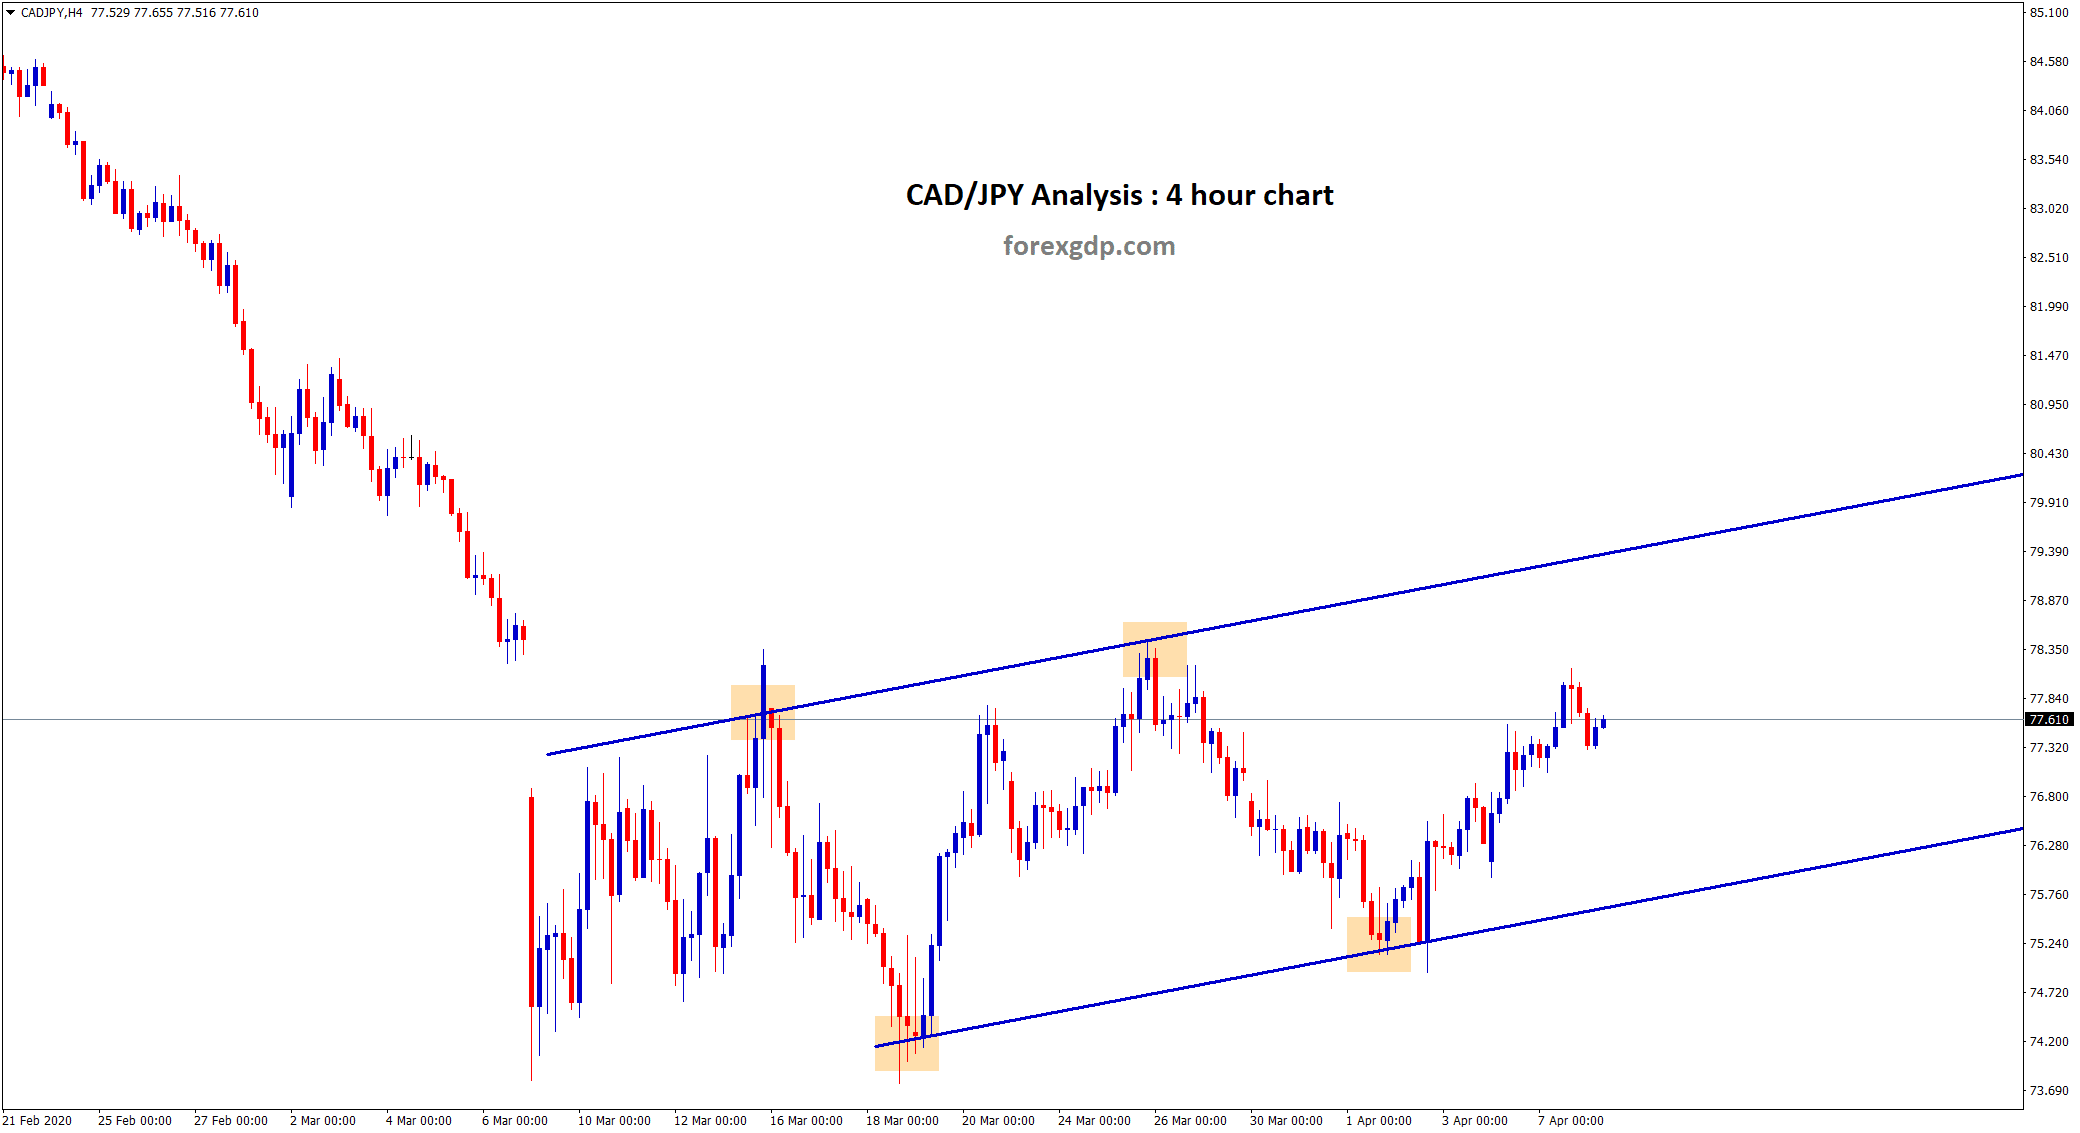
CADJPY still have space to move up in 4 hour chart. but market is making sideways now.
As per Forex GDP rules, if the market is moving between the entry price level for long time (2 days), we recommend our traders to close the position at entry price level (break even).
We don’t want our users to hold the trade for longtime where the market is not making movement.
Please Don’t trade all the time, trade forex only at best trade setup.
It is better to do nothing, instead of taking wrong trades.
We are here to help you for taking the trades only at best trade setup.
If you like to receive forex signals at good trade setup, Try our forex signals free.
If you want more forex signals try our Premium or Supreme forex signals plan.
Thank you.