

Trading isn’t just about numbers on a screen—it’s about understanding the story those numbers tell. And when it comes to Forex, stocks, or crypto trading, candlestick charts are like the language of the market. Each candle is a sentence, and together they form a narrative of buyer vs. seller battles. But here’s the truth: most beginners misread candlesticks. They jump into trades too early, ignore key signals, or worse—assume one candle predicts the entire market. That’s how accounts blow up.

If you’ve ever stared at candlesticks wondering what they mean, you’re not alone. In this guide, we’ll break it down in a simple, conversational way. By the end, you’ll understand how to read candlesticks like a pro and avoid the traps most traders fall into.
1. What Are Candlesticks, Really?
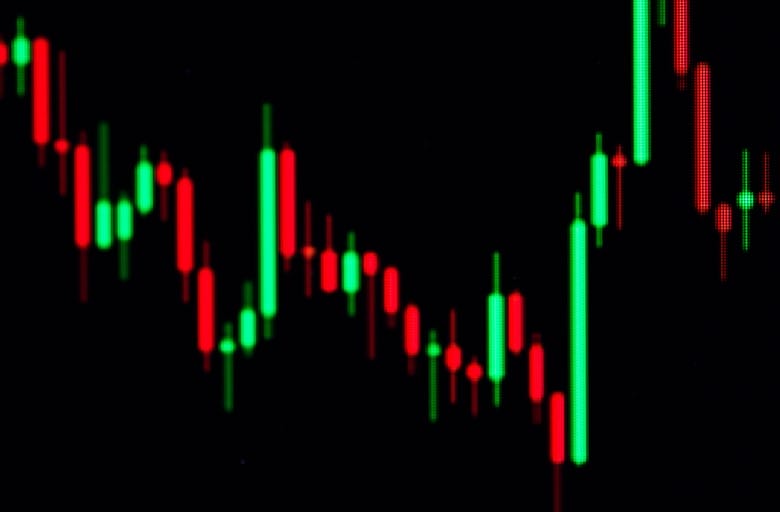
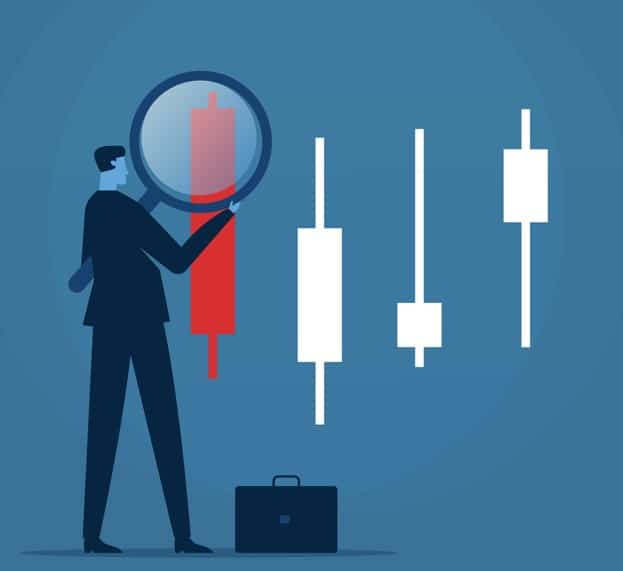
At its core, a candlestick is just a visual way of showing price movement over time. Each candle represents four things:
-
Open: Where the price started.
-
Close: Where the price ended.
-
High: The highest point reached.
-
Low: The lowest point touched.
The body of the candle (the thick part) shows the range between open and close. The thin lines (called wicks or shadows) show how far buyers or sellers pushed the price before it snapped back.
Think of it like a tug-of-war. Buyers pull one way, sellers pull the other. The candlestick freezes that moment in time so we can analyze who’s winning.
2. Why Candlesticks Beat Line Charts
Ever seen a line chart? It looks clean, but it hides too much. Line charts only show closing prices. That’s like reading the last page of a book—you miss the drama in between.
Candlesticks, on the other hand, show the battle: who tried to push the price higher, who fought it back down, and who eventually won. Without candlesticks, you’re basically trading blindfolded.
3. The Color Code: Buyers vs. Sellers

Colors matter. Typically:
-
Green/White Candles: Price closed higher than it opened → buyers won.
-
Red/Black Candles: Price closed lower than it opened → sellers won.
But here’s the trap: just because a candle is green doesn’t mean buyers are in full control. Context matters. A weak green candle after a massive red one might just be a pause before the next drop.
4. Buyers Getting Stronger: The Bullish Signs
When buyers are getting stronger, you’ll see candles with:
-
Long bodies moving upward.
-
Small wicks on top, meaning buyers pushed up and held control.
-
Consecutive green candles climbing higher.
This usually signals momentum building. But don’t get fooled—markets love to fake out greedy traders before reversing.
5. Buyers Getting Weaker: The Warning Signs
Markets whisper before they scream. Weak buyers show up as:
-
Small candle bodies after a strong uptrend.
-
Long upper wicks, showing sellers pushed the price back down.
-
Doji candles (tiny bodies) signaling indecision.
If you see this after a big rally, it’s often the calm before the storm—a possible reversal.
6. Sellers Getting Stronger: Bearish Momentum
Sellers flex their muscles when:
-
Candles have long red bodies.
-
Little to no lower wicks, meaning sellers crushed buyers.
-
Multiple red candles stack together.
This is often the start of a downtrend. Ignore it, and you’ll be holding a bag of losses.
7. Sellers Getting Weaker: Signs of Exhaustion
Even strong downtrends get tired. Signs sellers are running out of steam:
-
Small-bodied red candles after a big fall.
-
Long lower wicks, showing buyers are stepping in.
-
Dojis at the bottom of a move.
This doesn’t always mean reversal, but it does scream “caution.” Don’t chase shorts blindly.
8. The Power of Wick Analysis
Wicks are like footprints in the sand—they reveal hidden struggles.
-
Long upper wick: Buyers tried, but sellers slapped them down.
-
Long lower wick: Sellers tried, but buyers pushed back.
-
No wick: Total domination by either side.
If you ignore wicks, you’re missing half the story. Always ask: who tried harder, and who actually succeeded?
9. Common Candlestick Patterns You Can’t Ignore
Some candles grouped together form powerful patterns:
-
Doji: Indecision, market confusion.
-
Hammer: Buyers fighting back after a drop.
-
Shooting Star: Sellers smacking down after a rally.
-
Engulfing Patterns: One candle completely eats the previous → big reversal signals.
But here’s the kicker: these patterns mean nothing without context. A hammer in the middle of nowhere? Useless. A hammer at support? Now that’s gold.
10. Candlesticks Lie Without Context
One of the biggest mistakes? Believing candlesticks predict the future alone. They don’t.
Candles show psychology, not prophecy. A bullish candle at resistance is way different than a bullish candle at support. You must combine candlesticks with trendlines, zones, and volume to see the full picture.
Otherwise, you’re just gambling.
11. How Beginners Misread Candlesticks
Most beginners:
-
Chase green candles thinking “uptrend confirmed.”
-
Panic-sell on one big red candle.
-
Forget to zoom out, trading on noise instead of signals.
This is why 90% of retail traders lose money. They treat candlesticks like magic tricks instead of clues in a puzzle.
12. Practical Tips to Master Candlestick Reading
Here’s how to avoid rookie mistakes:
-
Zoom out first – always know the bigger trend.
-
Check the wicks – they reveal failed attempts.
-
Wait for confirmation – one candle isn’t enough.
-
Match with support/resistance – candles only matter at key levels.
-
Control emotions – don’t get hypnotized by flashy green/red.
Think of candlesticks like road signs. A single sign won’t give you the whole map, but enough of them together will guide your way.
13. Buyers vs. Sellers: The Eternal Battle
Candlesticks are basically war zones. Each one shows the clash of buyers and sellers.
-
Buyers want higher prices → profit on longs.
-
Sellers want lower prices → profit on shorts.
When you read candles correctly, you’re reading the battlefield strategies. Strong buyer candles? They’re charging ahead. Weak seller candles? Their army’s running out of ammo.
But remember—wars have traps, ambushes, and fake retreats. The market loves to trick you.
14. Why Patience Is Your Superpower
The hardest part of candlestick trading? Waiting.
Everyone wants instant confirmation. But strong signals need multiple candles to develop. Jumping too early is like leaving the oven before the cake rises—you’ll end up with a half-baked trade.
Patience in candlestick reading isn’t optional. It’s survival.
15. Real-Life Example: Reading a Reversal
Imagine this: The market’s been dropping for hours. You see a huge red candle. Next candle? Small red body with a long lower wick. Then a green hammer forms right at a strong support zone.
What’s happening? Sellers pushed hard but failed. Buyers are stepping in. That’s your cue—a potential reversal brewing. If you wait for confirmation, you ride the wave up. If you jump early, you risk another drop. Context and patience save you.
16. The Dark Side of Candlestick Trading
Here’s what no one tells you: candlesticks can mislead.
-
Fake breakouts: Candle blasts through a level, then reverses.
-
Stop hunts: Wicks designed to wipe out retail stop losses.
-
Low-volume traps: Candles look strong but have no real backing.
If you don’t combine candlestick analysis with risk management, you’ll fall into these traps again and again.
17. Final Thoughts: Candlesticks Are a Tool, Not a Crystal Ball
Candlesticks are powerful, but only if you respect them. They’re not fortune tellers. They’re clues—breadcrumbs left by buyers and sellers.
The real skill isn’t memorizing patterns. It’s learning to read the story they tell within context. When you master that, you stop chasing the market and start anticipating it.
Conclusion
Understanding candlesticks isn’t just about spotting green vs. red. It’s about decoding the constant fight between buyers and sellers. Every candle tells part of the story—strength, weakness, hesitation, aggression. But no single candle gives the full picture.
The secret is patience, context, and discipline. If you treat candlesticks as tools, not magic wands, you’ll avoid costly traps. Remember: the market speaks in candlesticks. Learn the language, and you’ll finally understand what it’s been trying to tell you all along.
FAQs
1. Do candlestick patterns always work?
No, candlesticks don’t guarantee results. They show probabilities, not certainties. Always combine them with trend analysis and risk management.
2. What’s the most reliable candlestick pattern?
Engulfing patterns and hammers are strong, but only when they appear at key support or resistance zones. Without context, they’re meaningless.
3. Can beginners trade using only candlesticks?
They can, but it’s risky. Beginners often misread signals. It’s safer to use candlesticks alongside other tools like moving averages and support/resistance.
4. Why are wicks so important?
Wicks show failed attempts by buyers or sellers. Long wicks reveal hidden market battles that the candle body alone doesn’t show.
5. How do I practice candlestick reading?
Use demo accounts, study past charts, and journal your trades. Over time, patterns become easier to recognize, and your confidence grows.