

Trading can feel like a battlefield — prices jumping up and down, news headlines screaming for attention, and emotions pulling you in every direction. But if there’s one golden rule that separates smart traders from gamblers, it’s this: “Let the chart speak before you act.”
Charts don’t lie. They’re the silent storytellers of the market, showing you everything from investor psychology to supply and demand. This article breaks down exactly why charts matter, how to read them effectively, and how you can use them to make consistent, emotion-free decisions in your trading journey.
1. Understanding the Power of Charts in Trading
Charts are more than just lines and candles. They’re the visual language of the market. Every tick, every high, every low — it’s all recorded there.
When you rush into trades without analyzing charts, you’re essentially driving blindfolded. The market doesn’t care about your hunch or gut feeling. It reacts to real data, and that data is right there on the chart.
2. Why Acting Without the Chart Is a Costly Mistake
Have you ever entered a trade because a friend tipped you off or because a news headline looked promising? Chances are, you’ve experienced the pain of losses that followed.
Acting without checking the chart often leads to:
-
Chasing trades instead of planning them.
-
Overtrading due to emotional decisions.
-
Falling into fake breakouts or false reversals.
-
Ignoring key support and resistance levels.
When you let the chart “speak,” you give yourself a reality check before committing your money.
3. The Chart as Your Trading Map
Think of a chart as a map in an unknown city. Without it, you’re wandering aimlessly. But with it, you can see the roads, shortcuts, and even potential hazards.
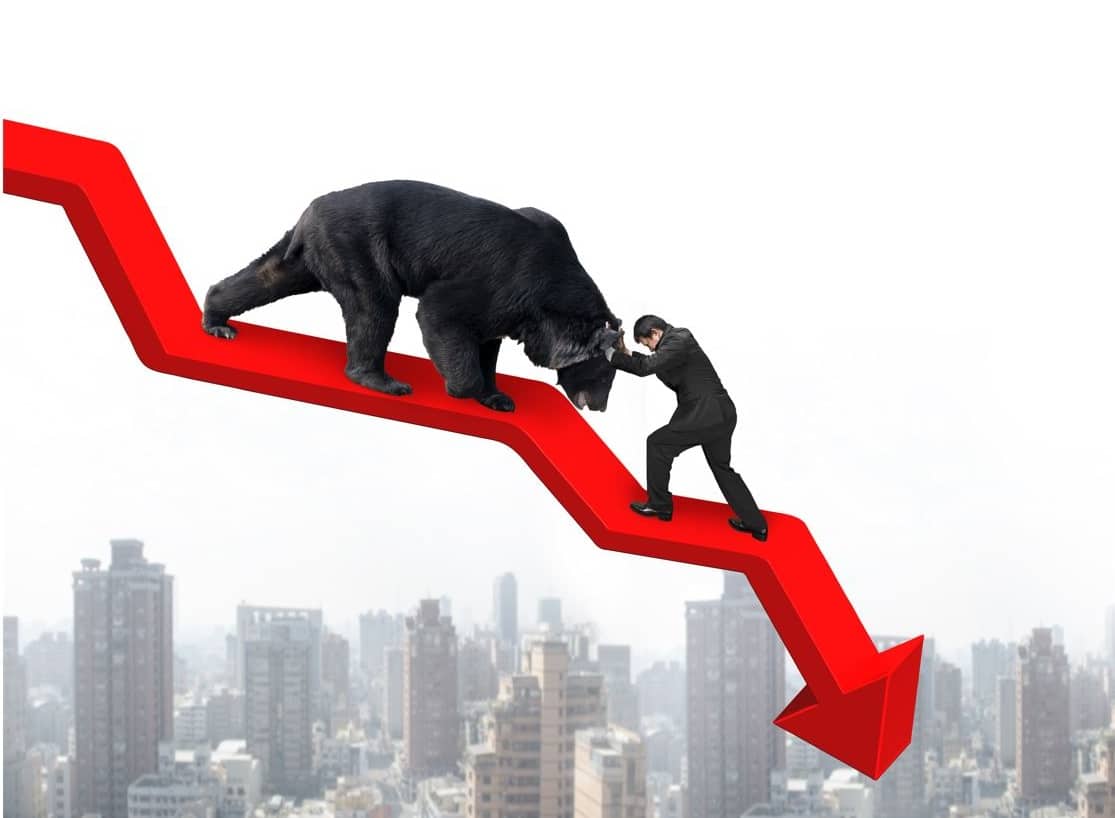
A price chart tells you:
-
Where the market has been (history)
-
Where it’s likely to pause (support and resistance)
-
Possible future paths based on trends and patterns
Using this “map,” you can plan your trades with confidence and precision.
4. The Emotional Trap: Why We Act Too Fast
Trading isn’t just technical; it’s deeply psychological. Fear and greed often trick traders into skipping their analysis.
-
Fear of missing out (FOMO): “The market is moving! I need to enter NOW.”
-
Revenge trading: “I’ll make up for that loss with the next trade.”
-
Overconfidence: “I know this pair always bounces back here.”
Charts cut through these emotions by giving you hard, unbiased data. Numbers don’t lie — and neither do candlesticks.
5. The Language of Charts: Key Elements to Learn
Before you can “listen” to a chart, you need to understand its language. Here are some fundamentals every trader should master:
Candlestick Patterns
Each candlestick tells a story about market sentiment. Learn patterns like:
-
Doji: Indecision in the market
-
Engulfing patterns: Strong reversals
-
Hammer and Shooting Star: Potential tops or bottoms
Support and Resistance
These levels are where price historically reacts. They act like invisible walls where price often bounces or reverses.
Trends
Is the market trending up, trending down, or consolidating? Recognizing trends early helps you trade in the direction of strength.
6. Technical Tools That Help the Chart Speak
Charts are powerful, but combining them with the right tools makes them even more effective. Some essential ones include:
-
Moving Averages: To identify overall trends.
-
RSI (Relative Strength Index): To spot overbought or oversold conditions.
-
Fibonacci Retracement: For identifying potential pullback levels.
-
Volume Indicators: To confirm if price movements are supported by strong participation.
These tools don’t predict the future, but they guide your decisions based on probabilities.
7. Timing the Market: Why Patience Pays
Patience isn’t just a virtue in life — it’s the key to profitable trading. Acting too quickly often leads to premature entries or missed exits.
When you wait for the chart to confirm your setup, you:
-
Reduce false signals
-
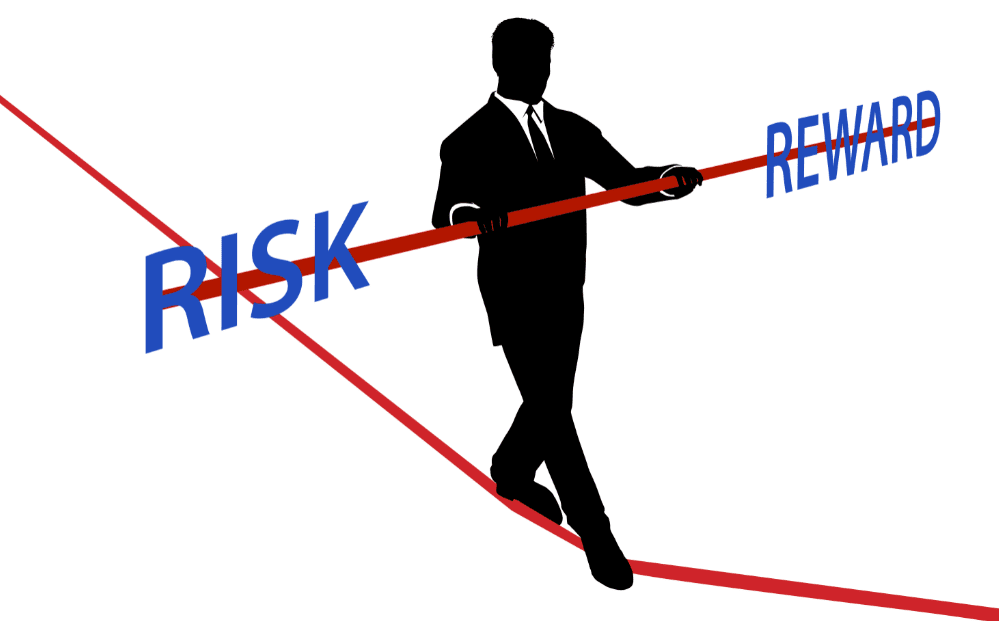
Enter trades with better risk-reward ratios
-
Stay in control instead of reacting emotionally
Think of it like fishing. You don’t yank the line the moment the water ripples; you wait for the right tug.
8. Real-Life Examples of Chart-Driven Wins
Imagine two traders:
-
Trader A acts impulsively after seeing a news flash about the euro. He enters without checking the EUR/USD chart and gets stopped out in minutes.
-
Trader B waits, studies the EUR/USD chart, notices a strong support level holding, and enters with a tight stop-loss. He rides the trade to profit.
The difference? Trader B let the chart speak before acting.
9. Common Mistakes When Reading Charts
Even when traders use charts, they often fall into traps like:
-
Overcomplicating the chart: Using too many indicators that give conflicting signals.
-
Ignoring higher timeframes: Making decisions based only on short-term charts without seeing the bigger picture.
-
Confirmation bias: Looking only for patterns that match their desired trade direction.
Avoid these pitfalls by keeping your analysis simple and objective.
10. Building a Chart-Driven Trading Routine
Consistency comes from process, not luck. Here’s a simple daily routine to help you rely more on charts:
-
Pre-market analysis: Check the major pairs and key levels before the market opens.
-
Identify setups: Mark possible trade zones and entry points.
-
Set alerts: Let technology notify you when your levels are reached.
-
Review trades: At the end of the day, analyze your entries and exits to learn from them.
11. The Psychological Edge of Listening to Charts
When you build the habit of letting charts guide you, something incredible happens — you stop second-guessing yourself.
-
You gain confidence in your trades.
-
You cut down on stress and anxiety.

-
You develop a disciplined approach that sets you apart from emotional traders.
This psychological edge often becomes the difference between long-term success and repeated failure.
12. The Harsh Reality: Charts Don’t Guarantee Profits
Here’s the truth no one wants to admit: charts are not magic wands. They don’t guarantee profits.
What they do is increase your odds of success by giving you clearer, data-backed insights. Combine that with proper risk management, and you’ll build a sustainable trading career instead of relying on luck.
Conclusion
“Let the chart speak before you act” isn’t just a catchy phrase — it’s a mindset shift. It reminds traders to pause, analyze, and make decisions based on what the market is actually doing, not what they hope it will do.
The market rewards patience, discipline, and informed decision-making. If you learn to truly “listen” to your charts, you won’t just avoid unnecessary losses — you’ll trade with confidence and consistency.
FAQs
1. Can beginners really understand charts easily?
Yes! Start with basics like support, resistance, and trends. Over time, patterns and indicators will make more sense.
2. Do charts work for all types of trading?
Absolutely. Whether it’s forex, stocks, or crypto, charts reflect price action, which is universal across markets.
3. How often should I check charts during the day?
It depends on your strategy. Swing traders might check once or twice a day, while scalpers may need to monitor charts constantly.
4. Can I rely only on charts without news?
While charts are powerful, combining them with major news awareness prevents you from being blindsided by sudden events.
5. What’s the biggest mistake traders make with charts?
Overanalyzing. Simplicity is key. Too many indicators can cloud your judgment and make decision-making harder.