

When it comes to forex and stock trading, most traders obsess over indicators, signals, and “secret” strategies. But let’s be honest: at the end of the day, price is king. And if you’ve been staring at charts long enough, you’ve probably noticed that price doesn’t just move randomly. It tends to react strongly at certain zones — the places where supply and demand fight it out. Today, we’re diving deep into one of the most powerful demand zone structures: the DBR pattern (Drop-Base-Rally).

This isn’t just another buzzword. Understanding DBR can completely change the way you enter and exit trades, how you set risk, and how you filter out bad setups. So buckle up, because by the end of this, you’ll not only recognize demand areas but also know how to trade them like a pro.
What Exactly Are Trading Demand Areas?
Think of demand areas like a shopping mall sale. Whenever a product hits a crazy discount, crowds rush in to buy. Similarly, in trading, a demand area is where buyers are eager to jump in and push the price up. These zones are often created after a sharp drop, followed by price stabilizing (base), and then a strong rally upward.
When price comes back to these zones later, guess what happens? Buyers often show up again — just like customers returning to a store when the “sale” is back. This repeated demand is exactly what traders want to capitalize on.
The DBR Pattern Explained
The Drop-Base-Rally (DBR) is one of the cleanest demand zone structures. It consists of three parts:
-
Drop – Price falls aggressively, usually signaling panic selling or profit-taking.
-
Base – Price stalls, consolidates, or moves sideways. This is where big buyers quietly start stacking their positions.
-
Rally – Price explodes upward as buying pressure outweighs selling pressure.
When price revisits that base in the future, it often reacts like a trampoline — bouncing back upward. That’s your golden entry point.
Why Is DBR So Powerful?
Here’s the catch: institutions, banks, and big traders can’t dump millions of dollars into the market all at once without leaving footprints. The DBR pattern is basically those footprints. The “base” is where they quietly load their trucks with positions. The rally is the confirmation that demand is stronger than supply.
When you identify these footprints, you’re no longer just gambling — you’re trading alongside the big players.
The Anatomy of a Demand Zone

Not all zones are created equal. A proper DBR demand zone usually has these characteristics:
-
Strong Drop before the base (showing sellers were in control).
-
Tight Base with small candles and wicks (showing accumulation, not indecision).
-
Explosive Rally with large candles and little pullback (showing real demand).
The cleaner these three stages, the stronger the zone. Think of it like building a house — weak foundations mean weak structure. A sloppy base often leads to weak rallies.
How to Mark the DBR Zone on Your Chart
This is where most beginners mess up. Marking demand zones isn’t just about drawing random boxes. Here’s a simple approach:
-
Identify the Drop: Spot the sharp bearish candles leading into the base.
-
Find the Base: Highlight the consolidation area with small-bodied candles.
-
Mark the Zone: Draw a rectangle from the highest point of the base to the lowest point.
-
Extend Forward: Push that rectangle into the future — that’s your demand zone.
Now, sit back and wait. Patience is key here. You don’t chase the rally; you wait for price to come back to your zone.
The Perfect Entry Strategy
When price returns to your DBR zone, you’ve got options:
-
Aggressive Entry: Place a buy limit order at the base and trust the setup.
-
Conservative Entry: Wait for a bullish candlestick pattern (like engulfing or pin bar) inside the zone before pulling the trigger.
Both methods work, but the conservative approach saves you from false breakouts. Remember, in trading, survival matters more than catching every single move.
Stop Loss and Target Placement
Here’s the million-dollar question: where do you put your stop?
-
Stop Loss: Just below the demand zone. If price cuts through it, the demand is gone — simple as that.
-
Target: Aim for recent supply zones, previous swing highs, or use risk-to-reward ratios (minimum 1:2 or 1:3).
Don’t get greedy. Respect your targets. The market always gives another opportunity if you manage risk wisely.
Common Mistakes Traders Make with DBR
Even the best zones fail if you misuse them. Here are rookie mistakes you want to avoid:
-
Forcing Zones Everywhere: Not every drop and rally is a valid DBR. Learn to filter noise.
-
Ignoring Freshness: The first retest of a zone is the strongest. Multiple retests weaken demand.
-
Trading Against Trend: Always align with the higher time frame trend.
-
Skipping Confirmation: Blindly entering without candlestick confirmation often leads to losses.
Trading DBR is like fishing — if you throw your net everywhere, you’ll catch junk. But if you throw it where the fish actually swim, you’ll strike gold.
DBR vs. RBR: Spotting the Difference
Many traders confuse DBR (Drop-Base-Rally) with RBR (Rally-Base-Rally). The difference is simple:
-
DBR: Created after a drop, signaling a reversal zone (demand).
-
RBR: Created during an uptrend, signaling a continuation zone.
Both are powerful, but DBR is usually stronger because it marks a turning point — where buyers overpower sellers.
Timeframes Matter
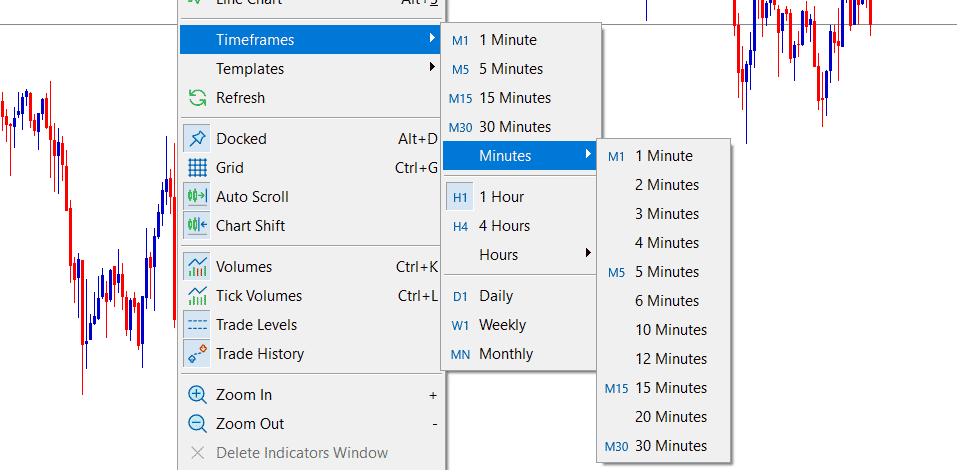
A DBR on the 1-minute chart isn’t the same as one on the daily chart. Higher timeframes create stronger zones because they reflect decisions by larger market participants. Here’s a rule of thumb:
-
Scalpers: Use 1m–15m zones.
-
Swing Traders: Use 1h–4h zones.
-
Position Traders: Use daily–weekly zones.
The bigger the timeframe, the fewer the false signals.
How to Combine DBR with Indicators
While DBR works brilliantly on its own, combining it with indicators adds extra confirmation:
-
RSI Oversold: Confirms buyers are stepping in.
-
Volume Spike: Confirms institutional activity.
-
Moving Averages: Confirms overall trend direction.
Think of indicators as seasoning. They enhance the flavor but don’t replace the main dish — which is price action.
The Psychological Trap of DBR Trading
Here’s the ugly truth: even the cleanest demand zones fail. And when they do, traders often panic, revenge trade, or abandon the strategy entirely. Don’t fall into that trap.
Remember: no setup is 100%. The DBR gives you an edge, not a guarantee. Your job is to manage risk, not to predict the future.
Practical Example of DBR in Action
Let’s paint a scenario. EUR/USD drops sharply, forms a tight sideways base, then rallies with strong bullish candles. You mark the base as your demand zone. Two days later, price retests the same zone, prints a bullish engulfing candle, and shoots up 100 pips. That’s DBR in real action.
If you had ignored the structure and just chased random indicators, you’d probably have missed it. But by following DBR logic, you entered at wholesale price and exited at retail.
Why Most Traders Fail with DBR
If DBR is so powerful, why don’t most traders succeed with it? Simple:
-
They lack patience.
-
They over-leverage.
-
They can’t stick to rules.
-
They confuse demand zones with random support lines.
In short, they sabotage themselves. The strategy isn’t broken — the trader is.
Tips to Master DBR Trading

-
Focus on quality zones, not quantity.
-
Use higher timeframes for confirmation.
-
Always respect your stop loss.
-
Be patient — let price come to you.
-
Keep a trading journal to track what works.
Consistency beats brilliance in trading. Master one pattern, and you’ll be miles ahead of 90% of traders.
Conclusion
The Drop-Base-Rally (DBR) demand zone isn’t just another flashy trading concept. It’s a proven structure rooted in market psychology and institutional activity. By learning to spot, mark, and trade these zones, you give yourself a massive edge over the average trader who relies on guesswork and lagging indicators.
But here’s the deal — DBR isn’t a magic bullet. It requires discipline, patience, and strict risk management. If you treat it like a casino trick, you’ll burn your account. If you treat it like a business strategy, you’ll start stacking consistent wins.
So the next time you open your charts, forget the noise, ditch the overcomplicated indicators, and ask yourself: “Where are the buyers hiding?” Chances are, they’re waiting in the DBR demand zone.
FAQs
1. Is the DBR pattern only for forex trading?
No, DBR works in forex, stocks, crypto, commodities — basically any market driven by supply and demand.
2. How do I know if a demand zone is strong?
Look for a sharp rally out of the base, tight consolidation, and a strong prior drop. The cleaner the structure, the stronger the zone.
3. Can DBR zones fail?
Absolutely. No pattern works 100%. That’s why stop losses are essential. A failed zone simply means demand didn’t hold.
4. What’s the difference between support and demand zones?
Support is just a horizontal line where price previously bounced. Demand zones are more dynamic, showing where big buyers are actually active.
5. Should I trade every DBR I see?
No. Focus only on fresh, clean zones that align with the higher timeframe trend. Quality over quantity always wins.