

If you’ve been trying to make sense of how the market moves, you’ve probably noticed that prices never move in a straight line. They climb, drop, stall, then repeat the cycle all over again. This is where the Wyckoff Method comes into play. It’s like having a map of the market’s psychology — helping traders understand what’s happening behind the candles instead of blindly guessing.
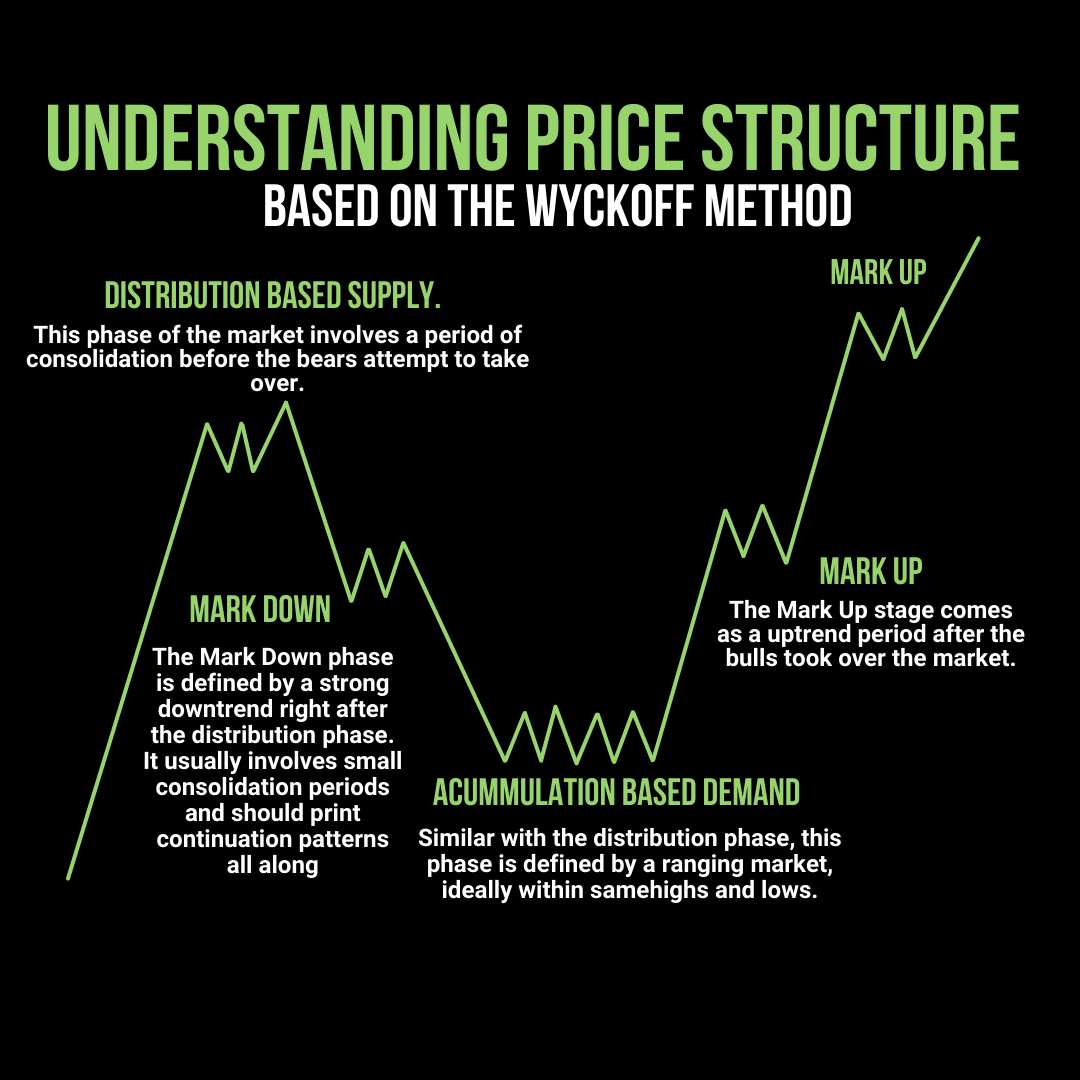
In this article, we’ll dive deep into price structure based on the Wyckoff method, breaking it down into phases like accumulation, distribution, mark up, and mark down. Whether you’re a beginner or someone looking to polish their trading edge, this guide will give you a full 360° view of how smart money manipulates price.
So, grab your coffee, because this is going to be long, detailed, and practical.
What is the Wyckoff Method?
The Wyckoff Method is not just another trading strategy; it’s more like a philosophy of how the market works. Richard D. Wyckoff, a pioneer of technical analysis in the early 1900s, noticed that markets are driven by the psychology of big players — the institutions, banks, and whales who control massive capital.
He broke the market down into predictable phases. These phases repeat themselves across timeframes and assets, making them a timeless approach. In essence, Wyckoff teaches you to read the story behind price action rather than blindly following indicators.
Think of it like this: while most retail traders are chasing after shiny objects, Wyckoff’s approach helps you sit in the driver’s seat and actually understand the narrative behind every market move.
Why Price Structure Matters
Before we get into the nitty-gritty, let’s answer one question: why even bother with price structure?
Because without it, you’re flying blind. Price structure is the skeleton of the market. It tells you when buyers are in control, when sellers are taking over, and when the market is simply pausing to catch its breath.
Here’s the harsh truth: most traders lose money because they ignore structure. They jump in late, buy when smart money is selling, or sell when whales are scooping up cheap positions. Understanding structure prevents you from being the liquidity that big players feast on.
The Four Phases of the Wyckoff Method
At the core of Wyckoff are four main phases:
-
Accumulation (demand-based)
-
Mark Up (trend begins)
-
Distribution (supply-based)
-
Mark Down (trend ends, reversal starts)
These phases are like the four seasons of the market — always repeating but never looking exactly the same. Let’s break each one down.
Accumulation Phase: Demand Quietly Builds


The accumulation phase is where the smart money quietly builds long positions. Imagine a farmer planting seeds in silence before the harvest. On the chart, this looks like a sideways ranging market with consistent highs and lows.
During this time, retail traders often get bored and leave, thinking nothing is happening. But behind the scenes, big players are preparing for the next big move. Volume is key here — you’ll often see spikes in volume at support levels as institutions buy into weakness.
If you’re sharp enough to spot accumulation, you can ride the entire trend that follows. But most traders fail because they expect fireworks during this stage — when in reality, the market is just laying the groundwork.
Mark Up Phase: Bulls Take Control
Once the smart money has accumulated enough, the mark up phase begins. This is where the market finally “wakes up” and prices start trending upwards.
Retail traders suddenly notice the move and start piling in, but guess what? Institutions were already in long before them. The mark up often happens fast and strong, catching latecomers chasing green candles.
A good analogy? It’s like a plane taking off. Those already on board get a smooth ride; those still at the airport are left running down the runway.
If you’re trading, this is the most profitable phase to ride. But you only catch it if you recognized accumulation early enough. Otherwise, you’re just buying someone else’s bags.
Distribution Phase: Supply Takes Over
Just like accumulation is quiet buying, distribution is quiet selling. After a strong uptrend, smart money begins unloading their positions at the top, distributing supply to eager late buyers.
On the chart, this looks like sideways consolidation again, but this time it’s near the top of a bullish run. You’ll see choppy action, false breakouts, and lots of fake bullish signs. Retail traders think it’s “just consolidating before another push up,” but in reality, it’s the calm before the storm.
Distribution is where the trap is set. Institutions are cashing out while retail buyers are trapped at the top, ready to be the victims of the next phase.
Mark Down Phase: Bears Take Control
The mark down phase is the opposite of mark up. This is when the market collapses after distribution. Sellers are now in full control, and retail traders who bought the “top breakout” are stuck holding losses.

Price moves fast here — just like an elevator going down is always quicker than walking upstairs. The chart shows sharp drops, small consolidation pauses, and continuation patterns all the way down.
Most retail traders panic, sell at the worst possible time, and swear off trading forever. But if you understand Wyckoff, this is just part of the cycle. The same way winter comes after autumn, the mark down always follows distribution.
How to Spot Accumulation vs. Distribution
One of the toughest parts is distinguishing between accumulation and distribution since both look like sideways ranges.
Here’s the trick:
-
In accumulation, volume spikes near support (buyers stepping in).
-
In distribution, volume spikes near resistance (sellers unloading).
Also, in accumulation, breakouts to the downside often fail (fake moves to shake weak hands). In distribution, breakouts to the upside often fail (bull traps).
It’s like telling the difference between a sunrise and a sunset — both look similar, but the direction of what comes next is completely different.
The Role of Smart Money
Let’s be brutally honest: retail traders don’t move markets. It’s smart money — institutions, hedge funds, banks — that decide where price goes.
Wyckoff’s entire method revolves around understanding these big players. They buy in accumulation, pump the market during mark up, sell in distribution, and then crash it during mark down.
If you think of the market as a chessboard, smart money is always three steps ahead. Your job isn’t to beat them — it’s to follow their footprints and avoid being sacrificed as a pawn.
Common Mistakes Traders Make


Here’s where most traders go wrong with Wyckoff:
-
They chase breakouts without context. Breakouts in distribution? That’s a trap.
-
They ignore volume. Volume is the “truth serum” of the market.
-
They don’t wait for confirmation. Jumping in too early leads to whipsaw losses.
-
They forget timeframes. What looks like distribution on the 1-hour may just be accumulation on the daily.
If you’ve been burned before, chances are you mistook one phase for another. Don’t beat yourself up — even pros mess this up. The key is learning from it.
How to Trade the Wyckoff Method
So how do you actually trade this? Here’s a simple breakdown:
-
During accumulation: Look for buy opportunities at support zones with high volume.
-
During mark up: Ride the trend with continuation patterns (flags, triangles).
-
During distribution: Be cautious. Take profits or look for reversal signals.
-
During mark down: Short the market or wait for the next accumulation.
The trick is patience. Most traders fail because they want to be in a trade all the time. Wyckoff teaches you to sit back, observe, and strike when the cycle confirms itself.
Wyckoff in Modern Trading
Some argue that Wyckoff is outdated — after all, he came up with this over 100 years ago. But the reality? Human psychology hasn’t changed. Fear and greed still rule markets.
Even in crypto, where everything moves faster, Wyckoff phases are crystal clear. Bitcoin, Ethereum, and altcoins all go through these same four phases, just on steroids.
Whether you’re in stocks, forex, or crypto, Wyckoff remains one of the most reliable ways to understand structure.
Practical Tips for Applying Wyckoff
-
Zoom out. Always check higher timeframes first.
-
Use volume. If you’re ignoring volume, you’re missing half the story.
-
Don’t chase. Wait for confirmation. Missing one move is better than getting trapped.
-
Keep a journal. Document your analysis of each phase to improve.
Remember, Wyckoff is not about predicting the market — it’s about understanding the market.

Conclusion
The Wyckoff Method isn’t magic. It won’t make you a millionaire overnight, and it won’t win every trade. But what it does give you is clarity — the ability to see through the noise and understand what the big players are doing.
Markets move in cycles: accumulation, mark up, distribution, and mark down. If you can learn to identify these phases, you stop being the prey and start moving alongside the predators.
It’s like learning the rhythm of a dance. Once you understand the beat, you stop tripping over your own feet and start moving in sync with the music.
FAQs
1. Is the Wyckoff Method only for stocks?
No, it applies to forex, crypto, commodities — basically any market driven by supply and demand.
2. How long does each Wyckoff phase last?
It depends. On lower timeframes, it could be hours. On higher timeframes, it could be months.
3. Do I need indicators to use Wyckoff?
Not really. Price action and volume are enough. Indicators can help, but they’re secondary.
4. Can beginners use the Wyckoff Method?
Yes, but it takes practice. Start by simply identifying the phases on charts before risking money.
5. Does Wyckoff guarantee profits?
No trading method guarantees profits. Wyckoff just increases your odds by aligning you with market structure instead of against it.