Skip to content
Monday, June 27, 2022
FOREX GDP

  • Forex Signals
  • Results
  • News Analysis
  • User reviews
  • FAQ
  • Brokers
  • EDUCATION
    • Change your Trading Mistakes
    • Low risk High Reward Strategy
    • Forex Chart Patterns
    • Courses
      • Basic Forex Course
      • Advanced Forex Course
    • Forex Basics
    • Forex Trading Guide
    • Forex Charts
    • Forex Scalping Signals
    • Forex Strategies
    • Forex Indicators
    • Types of Brokers
    • Forex Trading videos
    • Forex in Thai
    • தமிழ்
    • Calendar
  • About Us
  • Contact

usdcad long term

  • +2050 Points Reached in USDCAD buy signal after reaching the the higher low area of the ascending triangle

    img

    USDCAD Analysis: USDCAD has reached the higher low area of the ascending triangle in the weekly timeframe chart. USDCAD is…

    Read more >>

  • +1250 points reached in USDCAD Buy signal after rebounding from the higher low of the uptrend line

    img

    USDCAD Analysis USDCAD price is standing exactly at the higher low of the uptrend line and the new support level…

    Read more >>

  • +2250 Points Achieved in USDCAD after bouncing back from the support area and retest zone of the Triangle

    img

    USDCAD Analysis USDCAD is standing at the support zone and the Descending Triangle retest zone in the 4-hour Timeframe chart.…

    Read more >>

  • +1350 Points Achieved in USDCAD after bouncing back from the support area and retest zone of the Triangle

    img

    USDCAD Analysis USDCAD is standing at the support zone and the Descending Triangle retest zone in the 4-hour Timeframe chart.…

    Read more >>

  • +2100 Points achieved in USDCAD signal after hitting the higher low zone of an Uptrend Line

    img

    USDCAD Analysis: USDCAD has made a good correction from the high, now the price hits the higher low zone of…

    Read more >>

  • +2,330 Points achieved in USDCAD buy signal after retesting the Triangle pattern breakout

    img

    USDCAD Analysis USDCAD has broken the top of the Ascending Triangle pattern. After the confirmation of breakout, USDCAD Buy signal…

    Read more >>

  • USDCAD bounces back from the low level and closed at the entry price

    img

    After 4 years, USDCAD hits the 2017 Support level. USDCAD is bouncing back from the 2017 support level and lower…

    Read more >>

  • After 4 years, Today USDCAD hits the 2017 Support level

    img

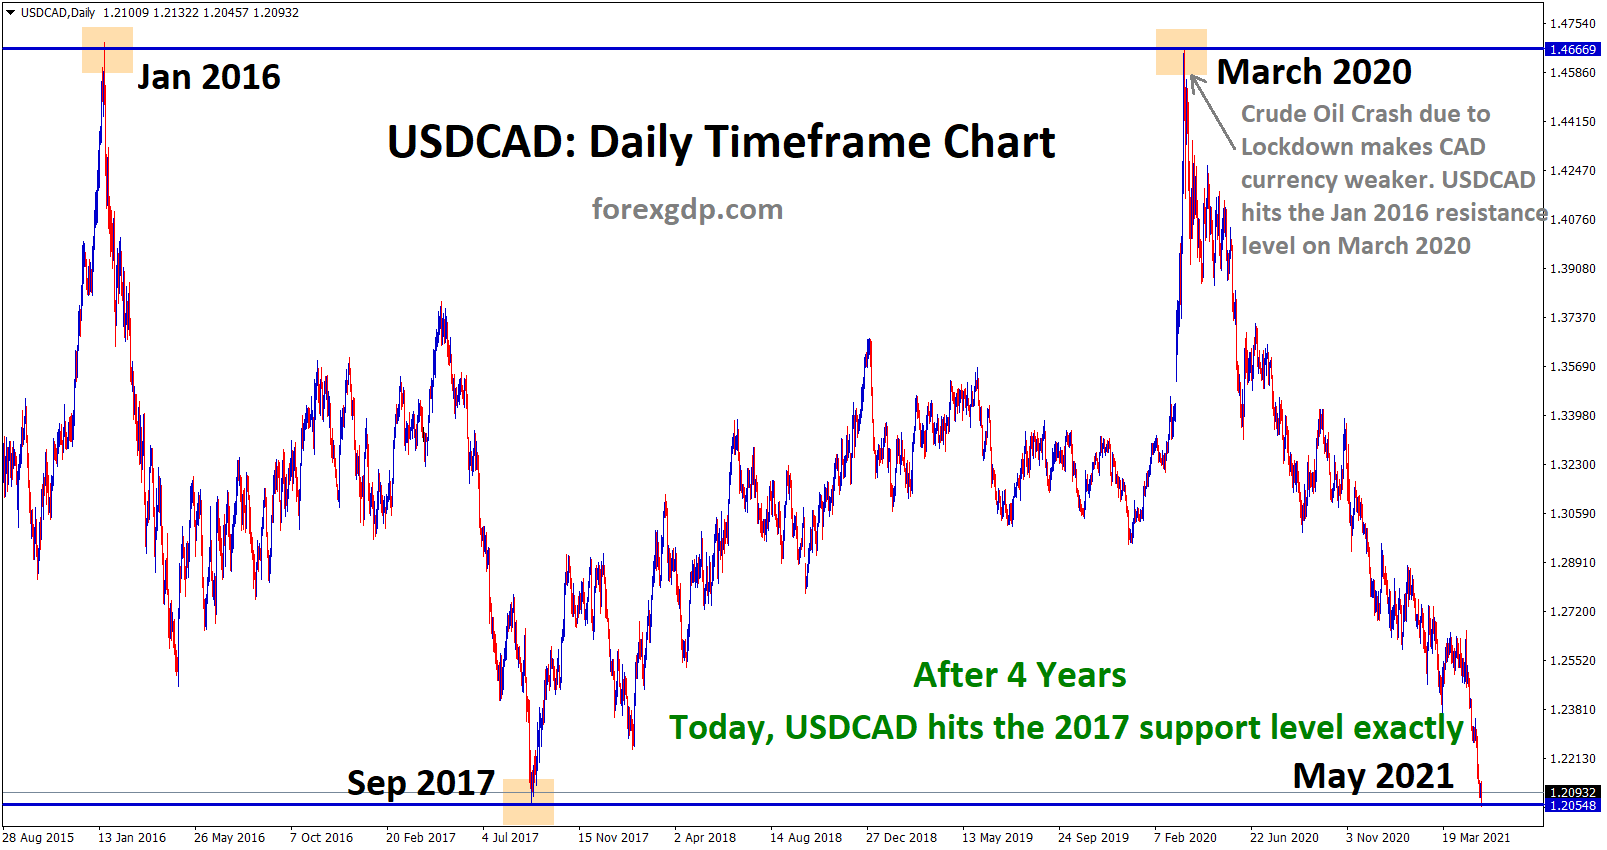
    USDCAD Historical Analysis USDCAD fall straight from the March 2020 resistance level to the Support without many retracements. After 4…

    Read more >>

  • +23,740 Points fall on USDCAD from the Top Resistance during Crude Oil Crash

    img

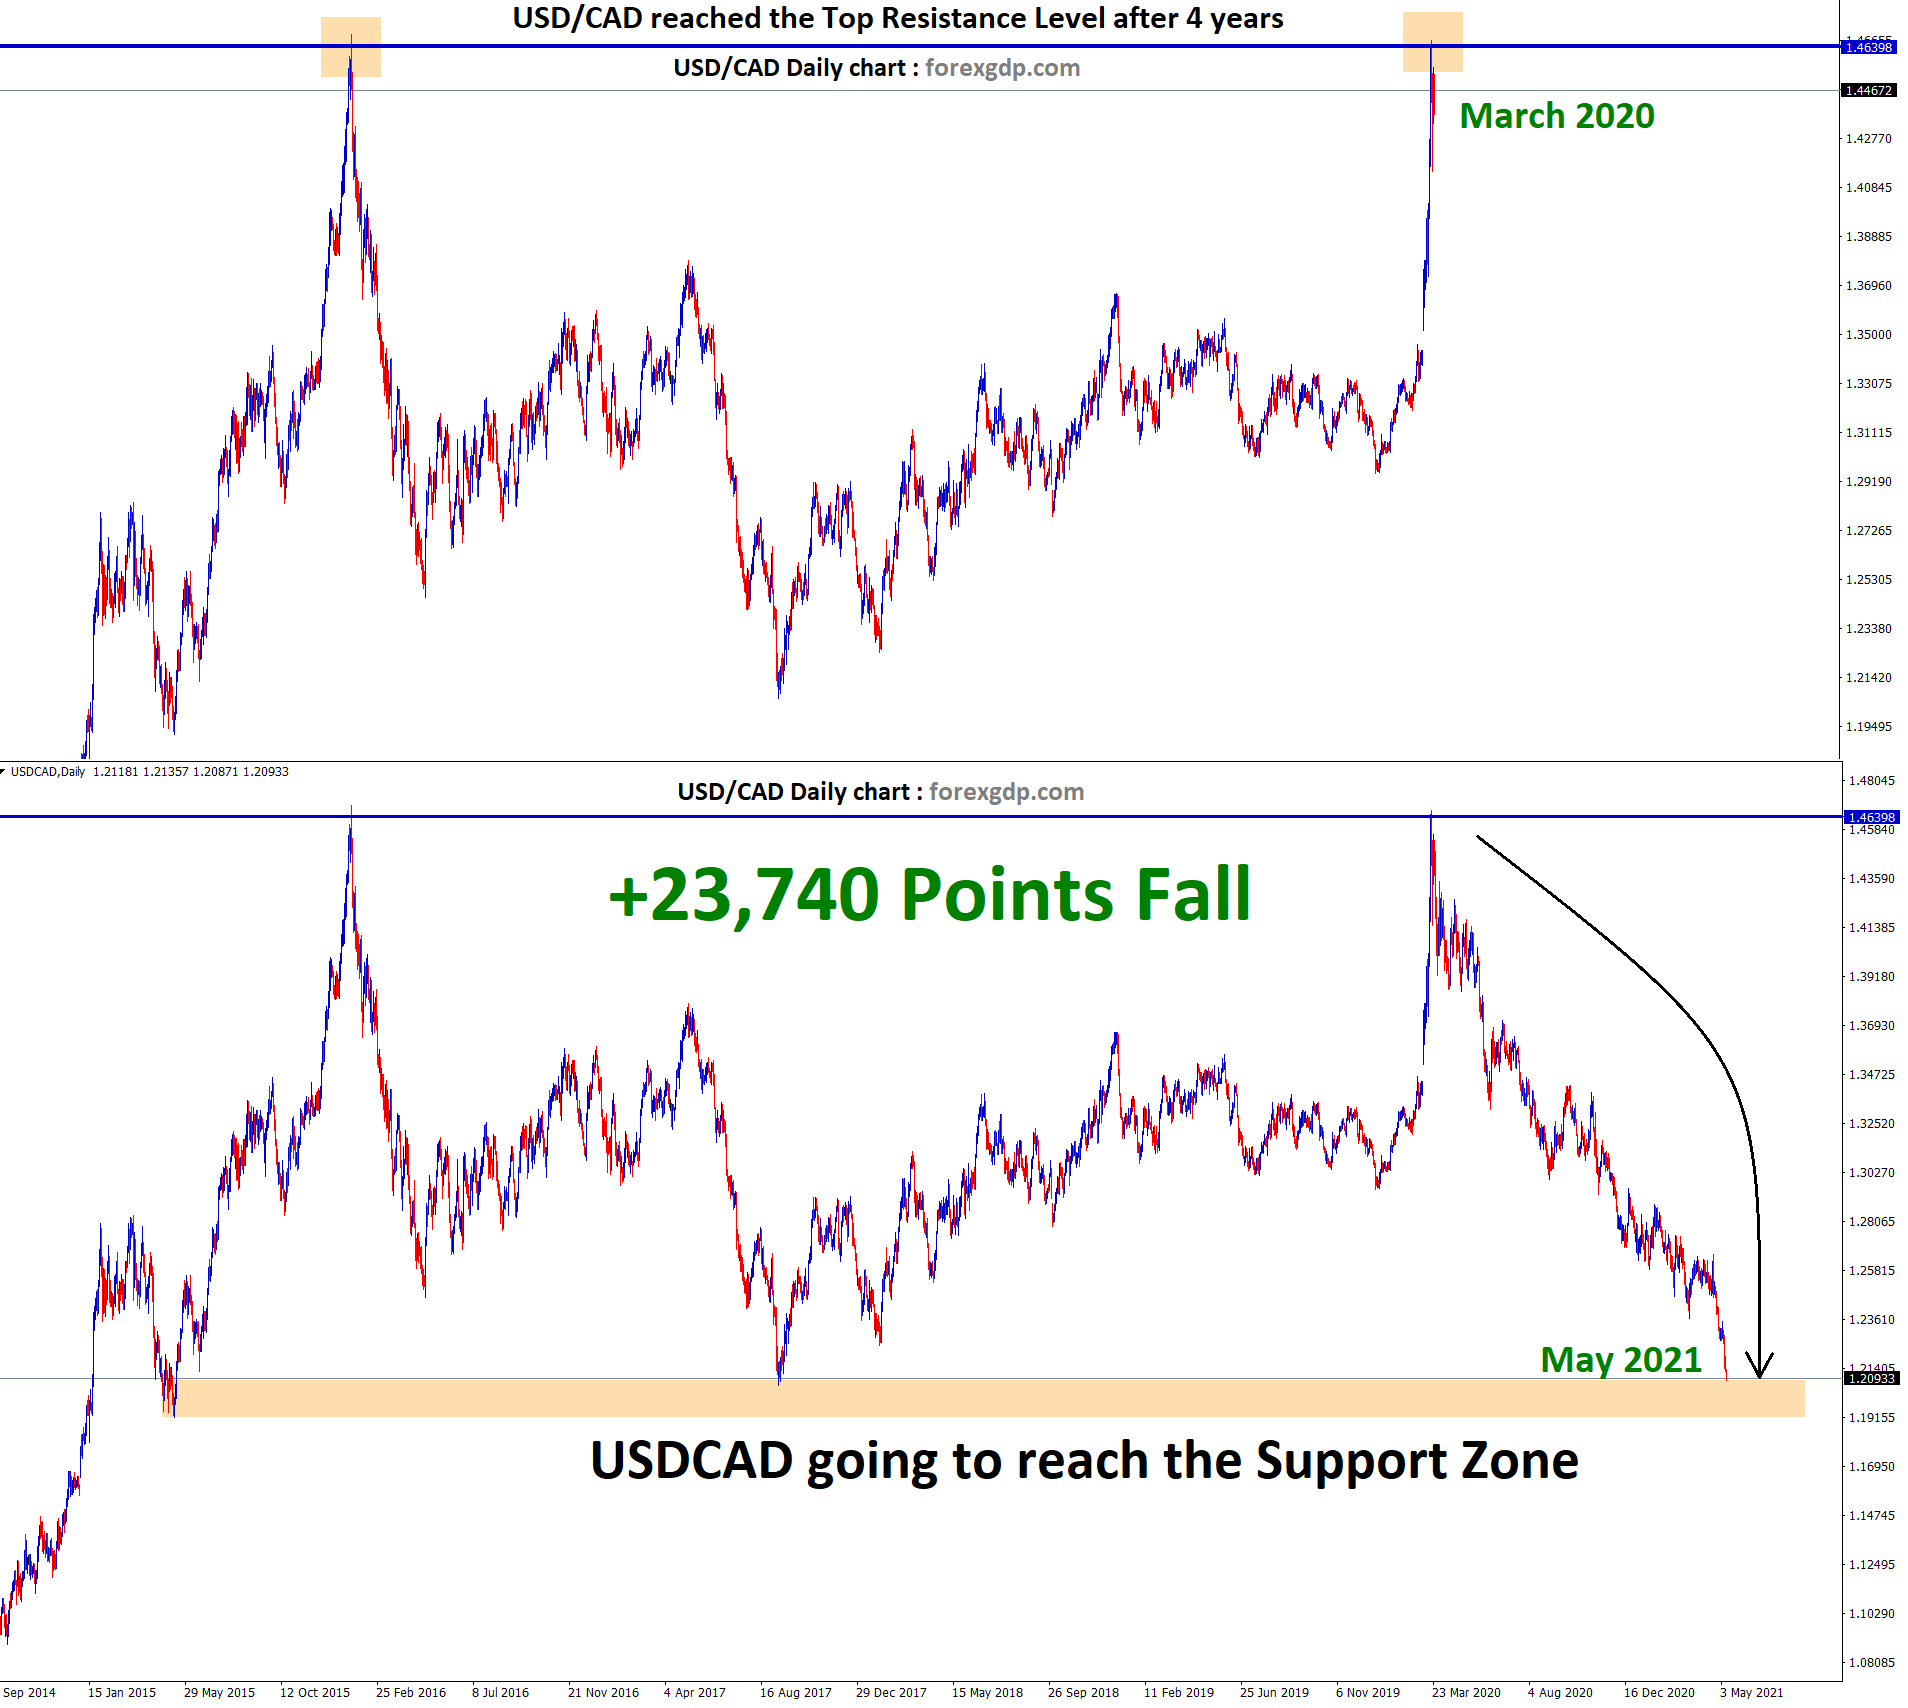
    USDCAD Double Top Analysis USDCAD has formed a double top pattern in March 2020. Crude Oil crash made the USDCAD…

    Read more >>

  • USDCAD, CADJPY, GBPCAD, EURCAD, AUDCAD, CADCHF at the key price levels. Good to enter?

    img

    USDCAD USDCAD has broken the major support level and now it reached the lower low zone of the minor downtrend…

    Read more >>

  • USDCAD wandering around the Support Zone

    img

    USDCAD Support Analysis USDCAD is wandering around the support zone from last few days. Let's wait for the confirmation of…

    Read more >>

  • USDCAD bounces back from the support zone

    img

    USDCAD Analysis USDCAD has reached the strong support zone for the fourth time. Now, the market bounces back from the…

    Read more >>

  • USDCAD at the key trend resistance

    img

    USDCAD is moving in a downtrend for a long time in the daily timeframe chart. Now, USDCAD is standing at…

    Read more >>

  • CAD Continues to get strong – USDCAD and CADJPY Analysis

    img

    CADJPY Technical Analysis CADJPY is moving in an Uptrend by forming higher highs, higher lows. Now, CADJPY is standing at…

    Read more >>

  • USDCAD price fall +3448 points after breakout at Support

    img

    USDCAD Descending Triangle breakout Analysis USDCAD formed a Descending Triangle pattern in 4 hour chart. We wait for long time…

    Read more >>

  • USD CAD hit 4 years high. Double Top forming ?

    img

    USD CAD creates a Double Top in the Daily chart Expecting a big fall soon. After 4 years, the market…

    Read more >>

  • +1370 Points Profit Reached Successfully in USD/CAD Buy Signal

    img

    USD/CAD Analysis :  In 4-hour chart, Breakout happened at the downtrend range and market starts to move up. [caption id="attachment_12238"…

    Read more >>

  • +1250 Points Profit Reached Successfully in USD/CAD Buy Signal

    img

    USD/CAD Analysis :  USD/CAD is moving up and down between the ranges in H4 Chart. USD/CAD reaches the support zone,…

    Read more >>

  • +1859 Points Reached Successfully in USD/CAD Buy Signal

    img

    Reason for Selling USD/CAD  : USD/CAD was moving up and down between the ranges in H4 chart. Finally, Breakout happens…

    Read more >>

  • +1159 Points Reached Successfully in USD/CAD Buy Signal

    img

    Reason for Selling USD/CAD  : USD/CAD was moving up and down between the ranges in H4 chart. Finally, Breakout happens…

    Read more >>

    • 1
    • 2
    • Next »

Get Free Forex Signals now on !

Telegram Forex Signals Whatsapp Forex Signals Instagram Forex Signals Facebook Forex Signals Twitter Forex Signals Youtube forex signals

Open Free Trading Account

Avatrade broker review
Exness broker review

About Us

Best sites to get payday loans online with no credit checks. FOREX GDP started by 20+ years Experienced Traders team who was worked with Major banks, Financial Institutions, Liquidity providers, Forex brokers in different job positions such as Equity Dealer, Fund Manager, Senior Market Analyst, Risk Manager and other major roles in Forex Trading Companies.

Products

  • WhatsApp Forex Signals
  • Telegram Forex Signals
  • FREE Forex Basics
  • Trading Videos
  • Trading Course with 2 yrs Mentorship
  • Best Trading Strategies
  • Best Forex Brokers
  • Terms of Service
  • Advertise with us
  • FAQ

Forex Signals

  • UK
  • Japan
  • Singapore
  • Thailand
  • Malaysia
  • South Africa
  • UAE
  • Australia
  • Canada
  • Indonesia

Analysis

  • Latest Chart Analysis
  • Gold – XAUUSD
  • EURUSD
  • GBPUSD
  • USDJPY
  • USDCAD
  • AUDUSD
  • GBPJPY
  • All Currency Analysis
  • Chart Patterns
  • Live Economic Calendar
Personal Loans: Which is Less Riskier and Secure?

Copyright © 2022 FOREX GDP. All rights reserved.

  • STRICTLY EDUCATION SERVICES ONLY
  • Disclaimer | Terms & Conditions