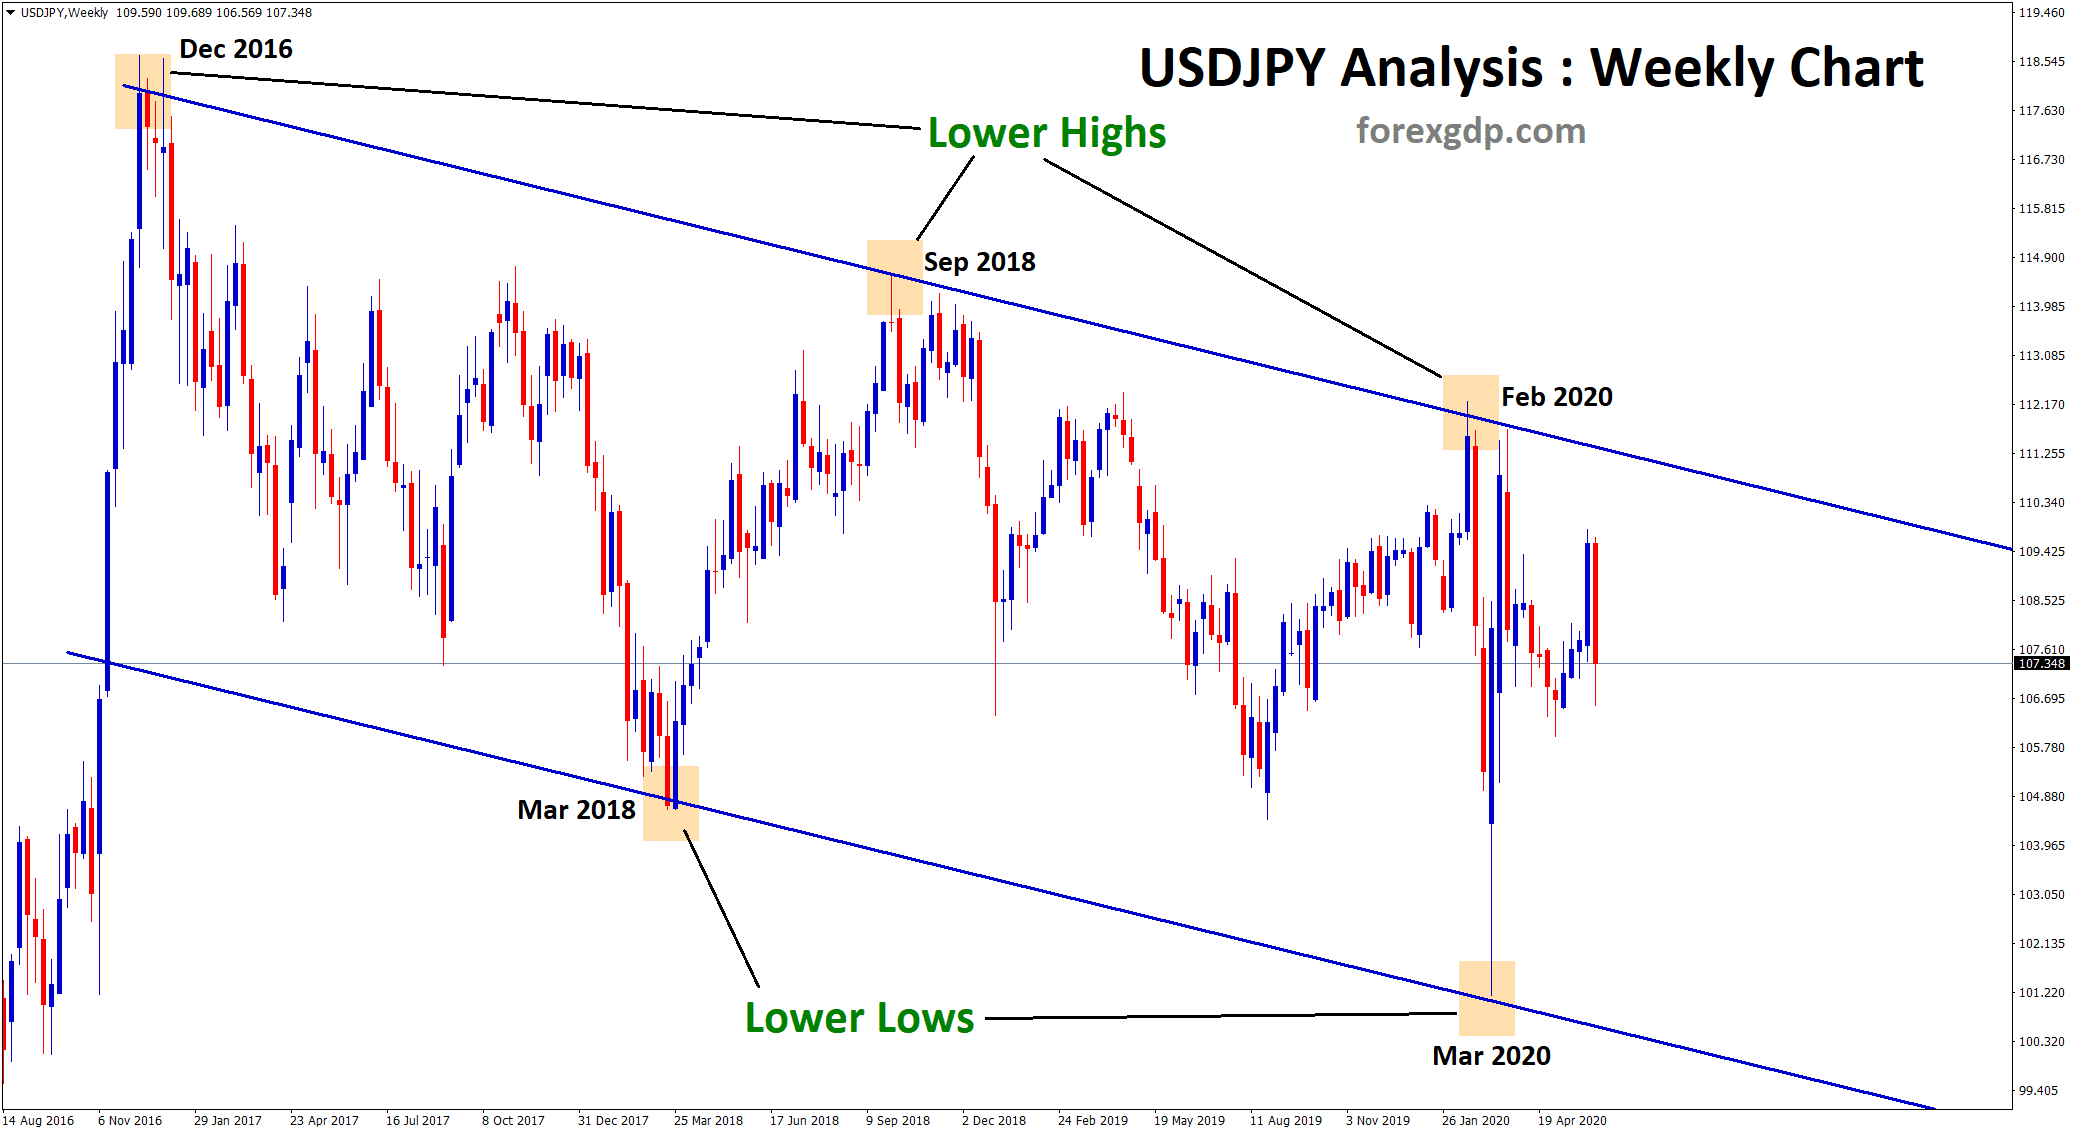
USDJPY Descending Channel Analysis
USDJPY is moving in a downtrend by forming lower highs, lower lows in Weekly Chart.
Since from December 2016, USDJPY starts to fall from 118 price level.
Then USDJPY made a 2nd lower high on Sep 2018, it’s exactly after 2 years.
Again after 2 years, on February 2020, USDJPY created another lower high.
After that COVID-19 impacted the market harder, Within 1-month market falls down to lower low in March 2020.
If you look out the previous lower low, it is on the same March month of 2018. Exactly after 2 years, USDJPY touched the lower low on March 2020.
Again the market made a big pullback to the lower high in a very short time.

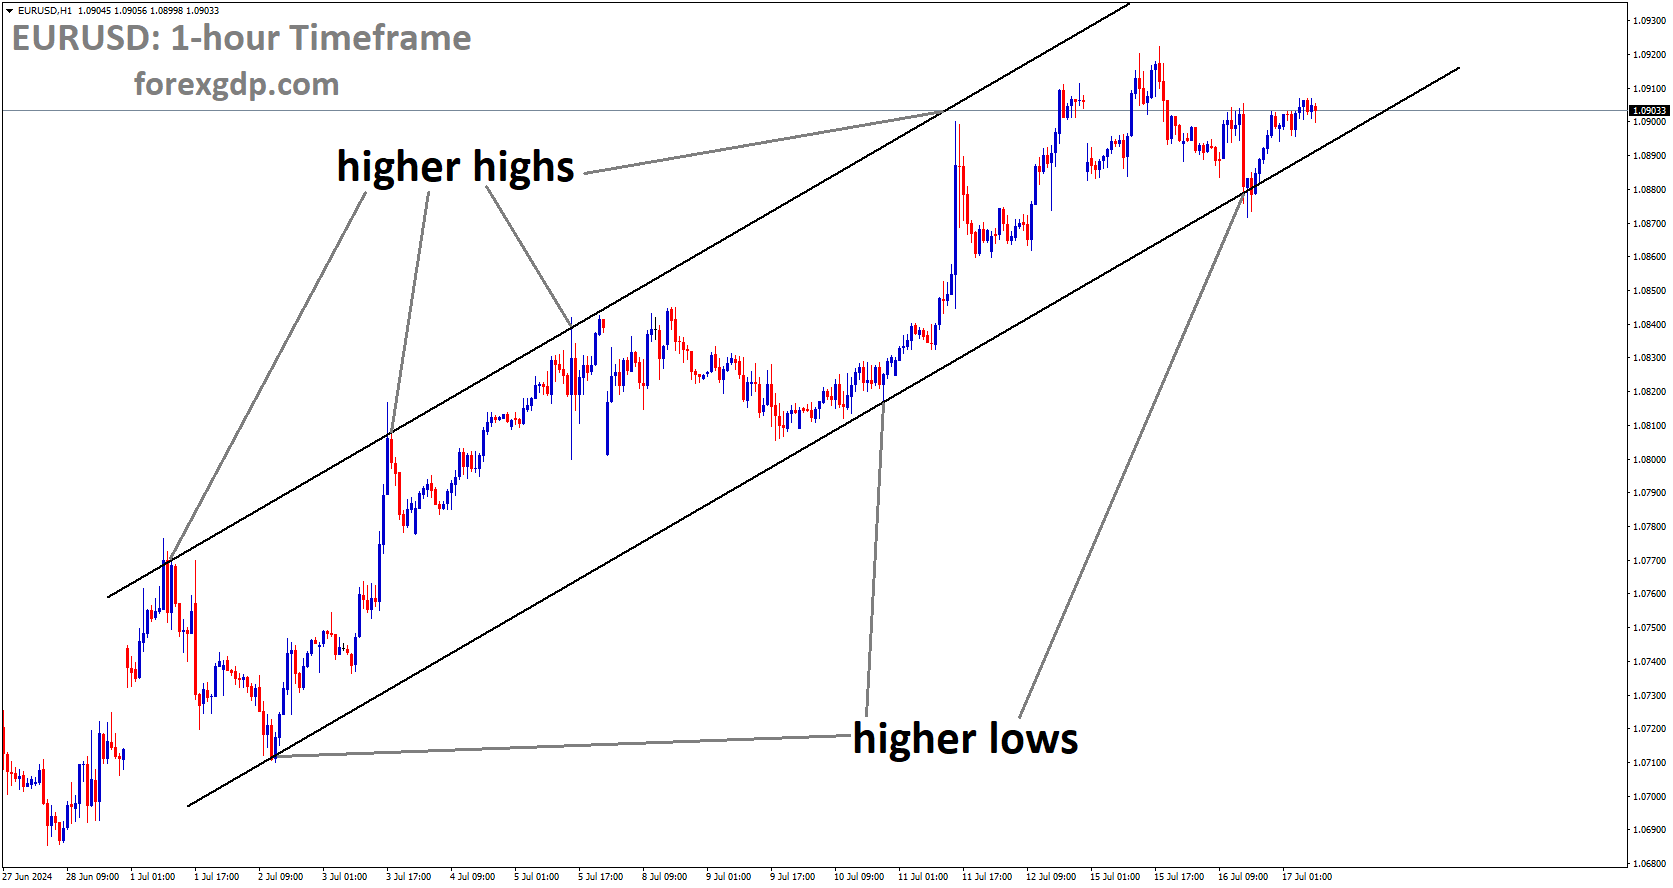
In 4 hour chart, USDJPY formed a symmetrical Triangle pattern by creating lower highs, higher lows.
Recently, USDJPY has broken the bottom level of the triangle and it’s trying to retest the breakout level now.
If you like to receive the best forex signals at good trade setup, you can Try free forex signals. (or) if you need additional important trade signals with high accuracy, Join now in Supreme or Premium forex signals plan.
If you want to learn trading from 20+ years expert traders, Join forex trading course online now.
Thank you.


I align myself with your Analysis on USD/JPY. Thanks