Gold has formed a double bottom in the 4-hour timeframe chart.

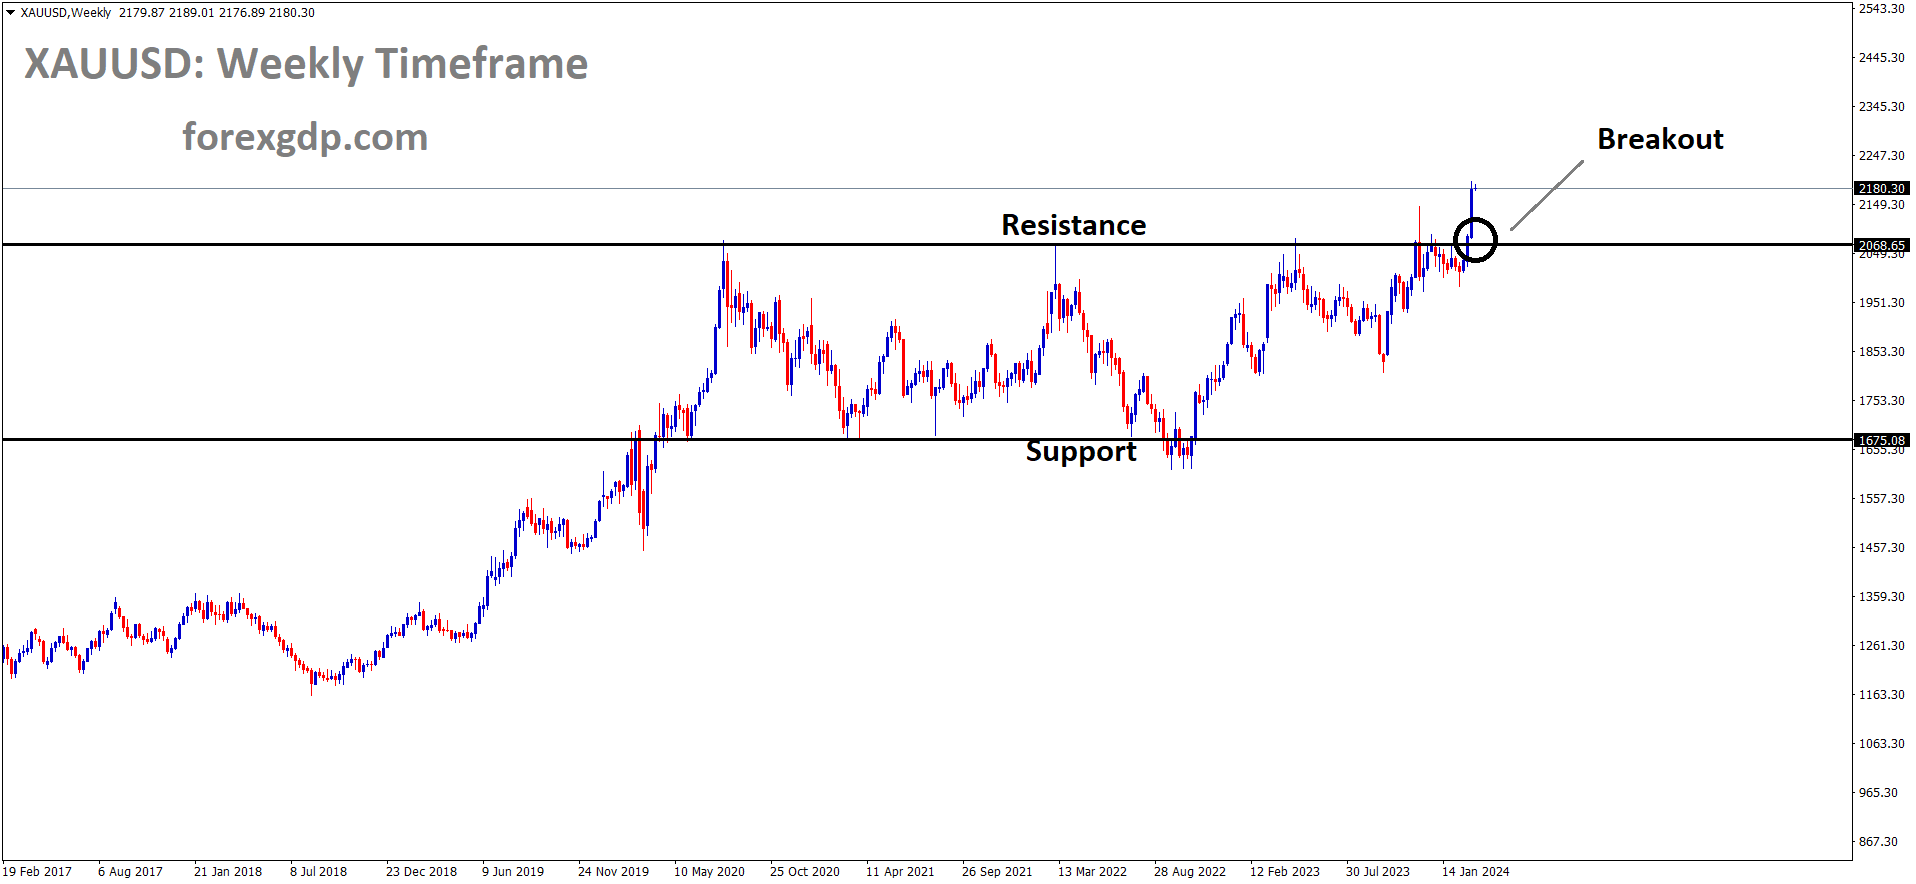
Gold has tested the support zone 1680 twice and it starts to bounce up.
In the long term view, GOld has reached the bottom level of the uptrend line as per our previous update (click here to see)

Gold Prices remains higher as US Dollar seems lower as unexpected Stimulus plan of $2.2 Trillion versus $3 Trillion expected.
Due to this, the Reflation expectation much lower as FED failed to lose monetary policy decisions in the upcoming meeting.
Due to Good Friday and Easter Holidays back-to-back we saw the Thin volume in the markets.

And Joe Biden’s package of $2.2 Trillion Favor’s for US Treasuries to move higher and Inflation made higher.
And also, Vaccination is in fast progress, makes the US economic recovery shows a resilient manner.
Due to this, Investor moved to demand US Dollar bonds and Keep away from Riskier currencies.
Don’t trade all the time, trade the markets only at the confirmed trade setups.
Get Each trading signal with Chart Analysis and Reason for buying or selling the trade which helps you to Trade with confidence on your trading account.
Want to increase your profits in trading? Get the best trading signals at an accurate time. Try premium or supreme signals now: forexgdp.com/forex-signals/