

There’s a whisper that runs through every trading room, every forum, every late-night chart session: “Let your trades make sense on the chart, not in your mind.” It’s not just a catchy quote. It’s a lifeline for anyone who has ever stared at a candle, hoping it would magically turn the color they needed. If you’ve ever convinced yourself that the market “just has to go up,” only to watch it slide the other way, you already know exactly what this message means.

Traders like to think they’re logical creatures, but let’s be honest—our minds can be drama factories. One moment you’re calm and collected; the next, your thoughts are racing like you’ve had five cups of coffee and a shot of adrenaline. The chart, on the other hand, doesn’t care about your hopes, doubts, or internal pep talks. It tells the truth, whether you like it or not. And learning to trust that truth can feel like learning to breathe underwater.
Still, something special happens when you stop wrestling with imaginary scenarios and start paying attention to the facts right in front of you. You begin to see the market not as a personal enemy or a puzzle that owes you answers, but as a landscape with patterns you can read—patterns that guide you, warn you, and even protect you if you’re willing to listen.
This article dives deep into what it really means to let your trades make sense on the chart, not in your head. And if you’ve ever felt overwhelmed by your own thoughts while trading, you’re in good company.
Why Traders’ Minds Betray Them More Than the Market Does
The Mind Loves Stories; Charts Don’t Care
Your brain is a world-class storyteller. It can take three candles and turn them into a dramatic prophecy about where the market is going next. Maybe you’ve caught yourself thinking, “It has to retrace now,” or “There’s no way it’ll break that support.” But the chart doesn’t respond to imagination. It responds to price, volume, liquidity, and momentum—things that don’t budge just because you want them to.
This mismatch between what your brain invents and what the chart actually shows is where most traders get destroyed. It’s like trying to navigate a forest using your feelings instead of the map in your hand. You’ll wander, you’ll stumble, and you’ll probably swear at a few trees. The chart is the map. The moment you get lost in your mind, the market becomes a maze.
What’s fascinating is how subtle the shift can be. One little assumption, one tiny “I think it might…” and suddenly you’re tied emotionally to an idea instead of letting the data guide you. And once you’re emotionally invested, objectivity becomes slippery. Before you know it, confirmation bias kicks in like an overeager stagehand, highlighting only the parts of the chart that support your fantasy.
Emotional Trading: The Silent Saboteur
Every trader has wrestled with emotions so loud they drown out the entire market. Fear that you’ll miss out. Hope that a losing trade will miraculously reverse. Anger that convinces you to “teach the market a lesson.” These emotions feel powerful—so powerful that they masquerade as logic.
But they don’t show up on the chart.
Fear doesn’t create a trendline. Hope doesn’t break a resistance. Anger doesn’t draw a double top. Yet traders act as if their feelings somehow influence price movement. The market moves with or without your emotional commentary. If anything, the more worked up you get, the more likely you are to ignore what the chart is screaming at you.
This is why traders often say the market is unfair or unpredictable. The market isn’t the problem. It’s the internal noise drowning out the clear signals. The chart shows what is. The mind is obsessed with what might be. That difference is where profits die.
How Charts Tell the Story You Need to Hear

Price Action Is the Market’s Actual Voice
Every candle is a statement. Every pattern is a conversation. Every zone, wick, and volume spike is a clue about what traders did, what they’re thinking, and where the pressure is building. When traders say, “Let the chart guide you,” it’s not some mystical mantra—it’s a reminder that the only trustworthy language of the market is the one spoken through price.
Price action doesn’t sugarcoat anything. If momentum is fading, it shows you. If a zone is being tested, it reveals it. If the market is exhausted or explosive or hesitant, you can see it in real time. Your mind may misinterpret intentions, but the chart shows results.
What surprises many traders is how grounded and simple trading becomes when you stop imagining and start observing. Your brain stops inventing chaos. Instead, it becomes analytical, calm, even curious. The chart becomes less like a battlefield and more like a map with clear borders and landmarks.
Patterns Are Not Predictions—They’re Probabilities
When you see a double bottom forming, your brain may want to shout, “It’s going up!” But the chart isn’t predicting. It’s presenting a probability. And probabilities require patience, not imagination. Traders get hurt when they turn probabilities into promises.
A pattern is evidence—not prophecy. It’s like seeing dark clouds in the sky. They suggest rain, but they don’t guarantee it. That’s how charts keep traders grounded. They show possibilities with structure, not fantasies with emotion.
When you remind yourself that the chart is a probability tool, you free yourself from the pressure of trying to be right. Instead, you begin to think in terms of “if this happens, then that’s likely.” The chart gives you the framework. The moment your mind steps in to force certainty, that’s when problems creep in.
Letting Data Speak Louder Than Desire
Objectivity Is a Trader’s Most Underrated Superpower
Imagine two traders looking at the same chart. One sees what he wants to see. The other sees what’s actually there. They’re not trading the same market anymore. One is trading reality. The other is trading a hallucination dressed as analysis.
Objectivity doesn’t mean being emotionless. It means being aware of your emotions without letting them hijack your decision-making. When you commit to objectivity, your chart becomes your anchor. Your mind may sway, but your strategy remains steady.
This is why journal-keeping, reviewing losing trades, and refining rules are so effective. They force you to see the gap between what you thought was happening and what the chart was actually showing. The tighter that gap becomes, the more consistent you get.
Desire Is the Enemy of Discipline
The market doesn’t care how badly you want a win. It doesn’t care how long you’ve been waiting, how stressful your day has been, or how desperate you are to recover losses. Desire blinds traders faster than anything else.
When you desire a specific outcome, you stop seeing alternative possibilities. You cling to trades that no longer make sense. You ignore stop signals. You gamble instead of analyze.
But when your attention shifts from desire to data, something shifts. You start to trust your setups. You start to exit quickly when the chart says the story has changed. You stop forcing trades where none exist.
Desire screams. The chart whispers. But the whisper is always more reliable.
How Traders Build the Habit of Chart-First Thinking
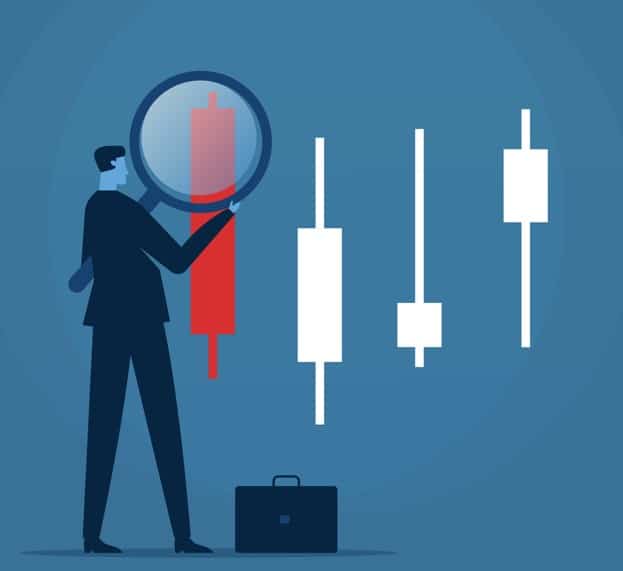
Learning to Pause Instead of Predict
One of the hardest skills in trading is learning to wait—not passively, but consciously. Pausing doesn’t mean doing nothing. It means observing and interpreting without leaping to conclusions. The more you pause before taking action, the more time you give the chart to reveal the truth.
When a setup looks tempting, that’s exactly when traders should pause. Not because opportunities are rare, but because urgency is usually a trap. A pause lets you ask better questions:
Is this the chart speaking, or my mind rushing?
Is the structure clear, or am I filling in the blanks?
Is the trend intact, or am I hoping for a reversal?
Pausing replaces impulsiveness with clarity.
Letting Structure Replace Storytelling
Whenever a trade idea enters your mind, it’s incredibly tempting to embellish it. To imagine how perfect the move will be, how clean the breakout will look, how satisfying it will feel when you’re proven right. But those thoughts aren’t analysis—they’re daydreams.
Structure, on the other hand, is grounded. It asks where the support is, how the trend behaves, where the liquidity sits, and how the candles react at key levels. Structure doesn’t flatter you. It doesn’t comfort you. But it protects you better than any fantasy ever will.
The more you rely on structure, the less stress trading brings. It’s like switching from a blurry guess to a crystal-clear lens. Suddenly the market stops feeling like chaos and starts feeling readable.
Where Traders Go Wrong When the Mind Takes Over
Seeing What You Want Instead of What Exists
The brain is sneaky. When you want a long position to be valid, you may start ignoring bearish signals. You convince yourself the wicks don’t matter, the volume doesn’t matter, the zone isn’t strong. You cherry-pick details like someone defending a bad argument.
But the chart doesn’t cherry-pick. It displays everything—good, bad, and inconvenient. Whenever you hide from the inconvenient parts, the market humbles you. Sometimes brutally.
Traders often laugh afterward, saying things like, “I don’t know why I ignored that rejection candle.” The truth is, they do know. The mind filtered it out because reality didn’t match the desired outcome. And the chart paid the price.
Holding Losing Trades Because of Ego

Ego is the quiet villain behind countless blown accounts. Once you believe you’re “right,” you stop being flexible. You refuse to close losing trades because you don’t want to admit the chart contradicted you.
But the market doesn’t care about your pride. It doesn’t reward stubbornness. It rewards adaptability.
When traders let the mind take control, they cling to trades out of ego instead of logic. The chart may be screaming for an exit, but the brain whispers, “Just give it one more candle.” That whisper is responsible for more damage than any volatile market move.
When the Chart Finally Becomes Your Guide
Trading Feels Lighter, Not Heavier
When you start trusting the chart, trading stops feeling like a tug-of-war between your emotions and the market. Decisions become cleaner. You stop arguing with yourself. You stop gambling. You stop forcing setups.
Everything feels lighter because you’re no longer carrying mental stories on your back. You follow structure, let the chart present opportunities, and take trades that actually make sense—not ones your imagination painted.
It’s a strange but beautiful shift when you realize you no longer need the market to do something specific. Instead, you just need it to show you structure. That mindset alone reduces anxiety, impulsiveness, and frustration.
Losses Stop Feeling Personal
A loss taken from a chart-based decision feels normal, almost neutral. But a loss taken from a mind-made decision feels like a punch to the ego.
When your trades make sense on the chart, the outcome becomes secondary. You know you followed structure. You know you respected the market. You know you acted based on evidence, not emotion.
Losses become data. Wins become validation. And both become steps toward consistency instead of emotional roller coasters.
Conclusion
At the end of the day, trading is not a battle against the market—it’s a battle against the stories your mind creates about it. The chart doesn’t lie, doesn’t get emotional, and doesn’t shift based on your feelings. It’s the only trustworthy voice in the chaos.
When you finally commit to letting your trades make sense on the chart and not in your mind, you step out of your own way. You start trading with clarity instead of hope, with structure instead of fantasy, and with discipline instead of desire.
This shift won’t happen overnight, but every time you choose the chart over your emotions, you become a stronger trader. A more objective trader. A more consistent trader. And eventually, a profitable one.
FAQs
Why do traders often ignore what the chart is showing?
Because emotions and desires cloud judgment. Traders want certain outcomes so badly that they mentally override the obvious signals on the chart.
Is price action more reliable than indicators?
Price action reflects raw market behavior. Indicators can help, but they often lag. The chart itself provides the clearest information.
How can I stop making emotional trades?
Focus on structure, use a trading plan, pause before entering trades, and remind yourself that the chart—not your feelings—dictates reality.
What happens when you trade based on assumptions?
Assumptions lead to losses. They push you to take trades that have no real structure or probability, only emotional attachment.
How do I know if a trade idea is based on the chart or my imagination?
Ask yourself whether the idea is supported by clear levels, trend behavior, and price patterns—or driven by hope, fear, or impatience.