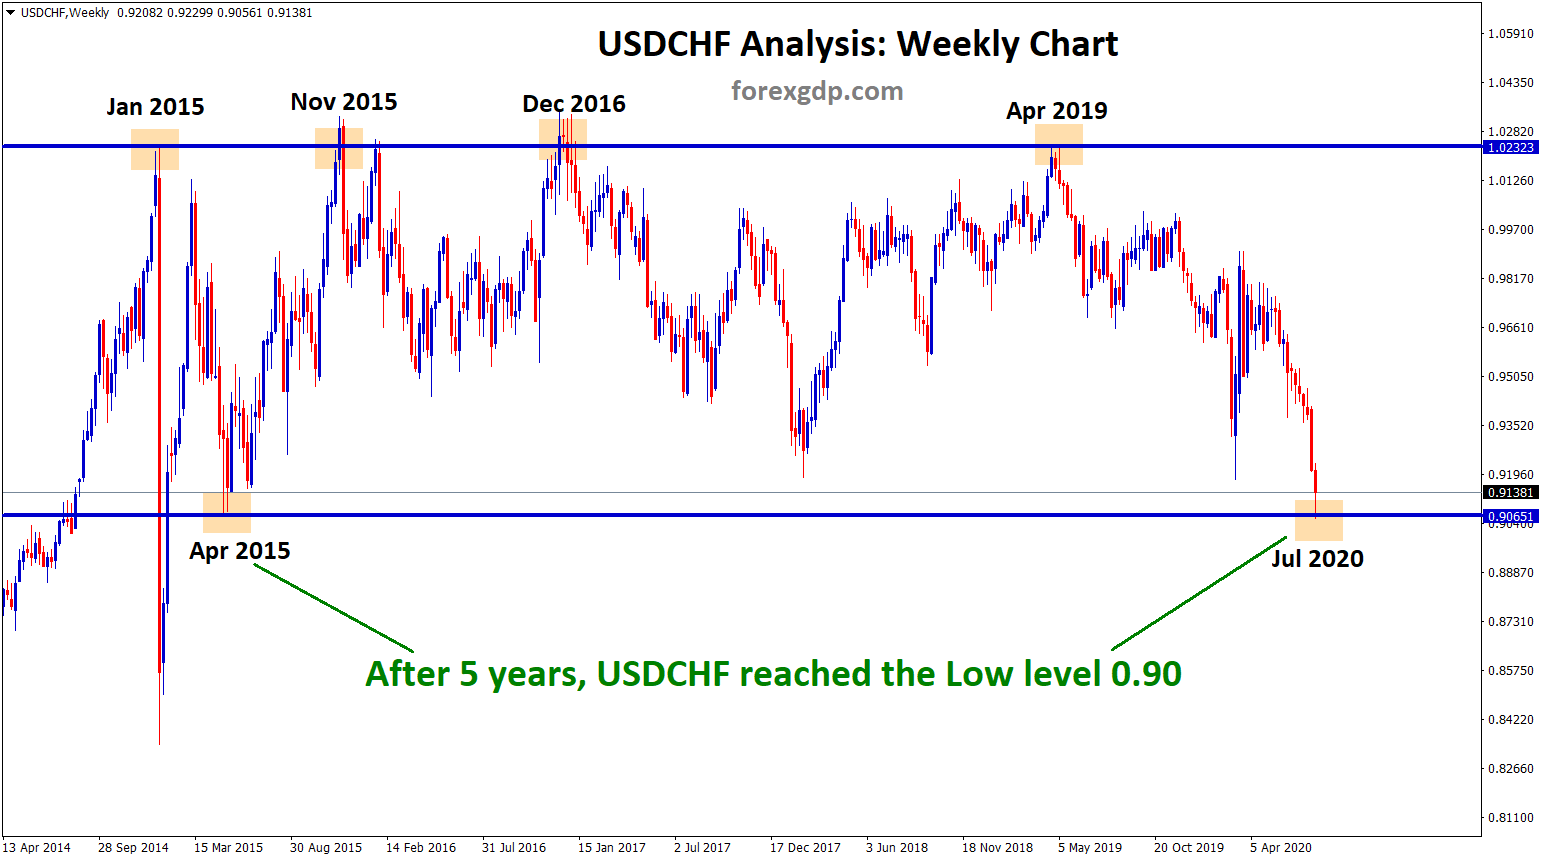
USDCHF Full View Analysis
Since from 2015, USDCHF is moving up and down between specific price ranges for a long time.
After 5 years, USDCHF reached the Low price level due to continuous weakening of US Dollar (check here the reason for USD Weakness)

In 4-hour time frame, USDCHF reached the Lower low and trying to bounce back.

In 1-hour time frame chart, USDCHF has broken the Descending Channel recently on Last week Friday.
This shows that “USDCHF have chances to bounce back from this bottom zone.
However, the reversal is not yet confirmed.
If the US Dollar continues to weaken, USDCHF will break this Low level and it will move further to the new low-level price.
USD Continues to Fall due to Covid-19
The dollar Declined last week and moved to the weakest month in 10 years due to continuous spread of coronavirus in US and failure of US lawmakers to agree on a new round of stimulus package.
Dollar index declines against six other currencies, Dollar Index was down 0.4% at 92.648 and it’s near to New 2 year low.
US GDP data contracts 32.9% shows clear economy weakness on the US dollar. latest stimulus measures are contracted by US President Donald Trump over election concerns, unemployment payment also expired on last week Friday.
Please Don’t trade all the time, trade forex only at best trade setup.
It is better to do nothing, instead of taking wrong trades.
We are here to help you for taking the trades only at best trade setup.
Start to receive the forex signals now: forexgdp.com/forex-signals/