USDCAD Analysis
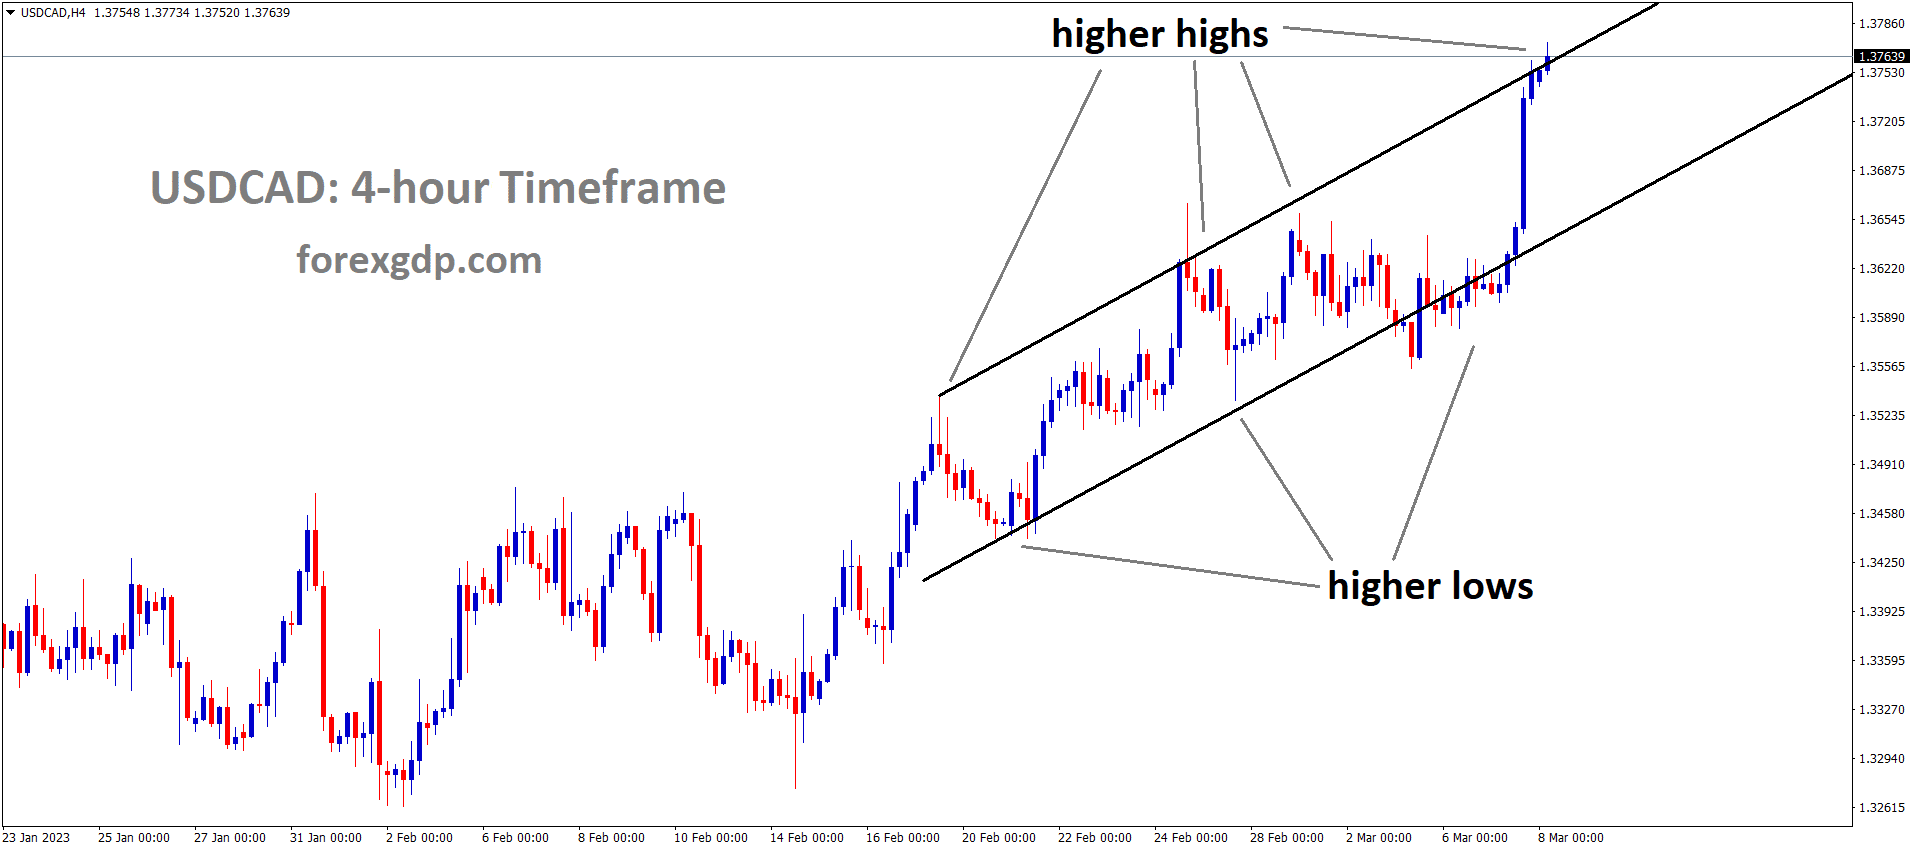
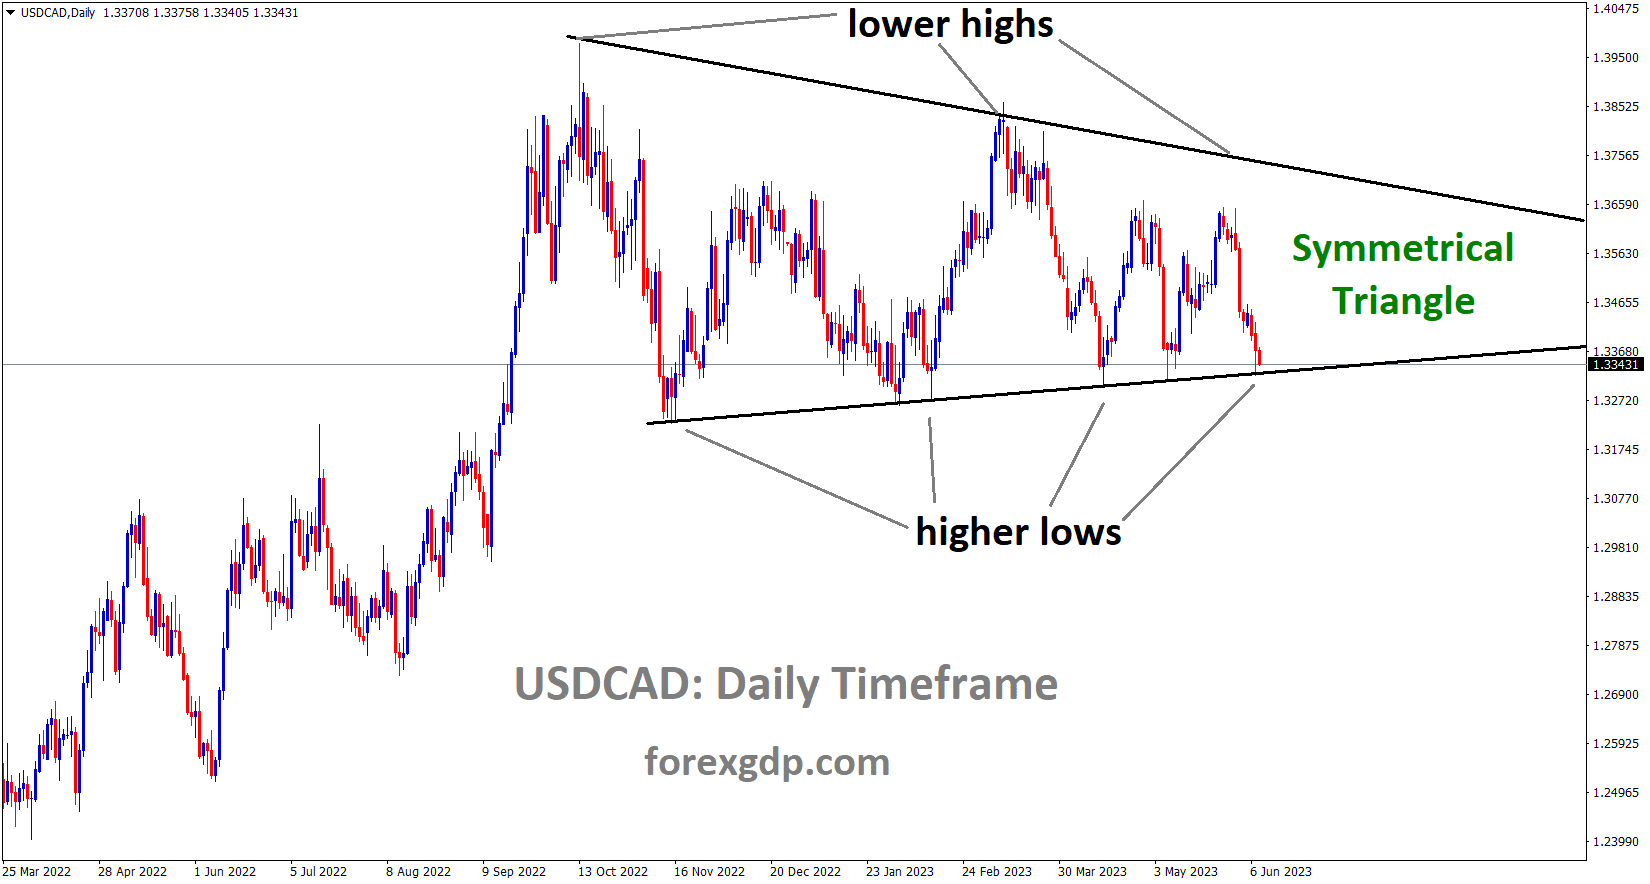
USDCAD is moving in the Symmetrical triangle pattern and the market has reached the bottom area of the pattern.
In response to higher inflation rates for services and food, the Bank of Canada increased the interest rate by 25 basis points yesterday. In April, there were 41400 more jobs added, and the CAD GDP increased to a 3.1% annualised Q1 result. The BoC stated that if inflation increases, interest rates may be raised in upcoming meetings.
As the Central Bank emphasised that excess demand in the economy appears to be more persistent than anticipated, the Bank of Canada followed the RBA and announced a 25 bps hike. The BoC believes that the rate increase reflects concerns that monetary policy was not sufficiently restrictive to restore supply and demand to equilibrium. The data from April showed increases in a wide range of goods, and service price inflation is still high, according to the BoC, who reiterated the upside risks and price pressures. The concern for major Central Banks that CPI inflation could get stuck materially above the 2% target is a worrying statement and something I have touched on for the past few months. An increase in tonear 50% of a subsequent hike in July and a full price in further tightening by September were observed immediately following the meeting.
Crude Oil Analysis

Crude Oil price is moving in the Descending channel and the market has rebounded from the lower low area of the channel.
After starting the cycle of rate increases earlier than its competitors, the Bank of Canada is still in the lead. This may contribute to the fact that Canada’s inflation situation continues to be better than that of the Euro Area and the US. Despite this, BoC Governor Tiff Macklem has emphasised the Central Bank’s readiness to take action if necessary and has maintained that upside risks to inflation remain a concern.With wages rising and unemployment remaining at just 5%, the Canadian economy added another 41,400 jobs in April, more than double the 20,000 anticipated. The Q1 GDP data, which showed a print of 3.1% annualised with rising consumer spending, is another indication of the economy’s resiliency. These numbers do raise concerns about the fight against inflation, especially given the strong consumer spending data as summer draws near. But according to Governor Macklem, a significant slowdown is anticipated for the second half of 2023. Given the publication of the OECD’s updated global projections, this prediction seems reasonable and may actually materialise. Could this signal the end of BoC’s hiking season? It might be the case, but given the market volatility and unexpected developments over the previous 18 months, I would not put my house on it just yet.
GOLD Analysis

XAUUSD Gold Price is moving in the box pattern and the market has rebounded from the horizontal support area of the pattern.
Following the release of positive NFP data last week, gold prices have stabilised. Because of the robust labour market and challenging economic climate, the FED is expected to raise interest rates again in July rather than this month. The US CPI and FOMC meeting are the main factors influencing the movement of the US dollar and gold next week.
The NFP report came in much hotter than expected, which indicated that the labour market is still going strong despite the fact that financial conditions are getting tighter all the time. As a result, gold prices fell rather sharply on Friday. Better-than-expected labour market data typically increases the likelihood of a rate hike, but because the Fed signalled a skip at this month’s FOMC meeting, markets still expect rates to stay the same. Given the lack of significant economic data this week, gold prices have been seen drifting between a wider range of 1937 and 1985 and are actively looking for their next directional move. In recent trading sessions, the appeal of the safe haven metal has decreased due to a bipartisan agreement to suspend the debt ceiling, but the precious metal has not yet demonstrated signs of a protracted sell-off. The US CPI and FOMC decision next week are almost certain to increase market volatility. If core inflation falls below the stubborn 5.5% level, that could support the idea that the Fed will be more dovish in its upcoming meetings and lead to a weaker dollar, which would support gold prices going forward.
USD Index Analysis

US Dollar index is moving in an Ascending channel and the market has reached the support area of the minor Box pattern.
The stronger US Treasury yields and bond markets help the US dollar maintain its upward trend. Initial Jobless Claims data for the US are anticipated to increase from yesterday’s reading. The US Debt Ceiling Limit Issue was resolved, allowing the US Dollar to maintain a positive correlation with other currency pairs.
US Dollar Index remains under pressure near 104.00 early on Thursday in Asia as hawkish Fed bets clash with worries about US growth during a slow session. In doing so, the dollar’s index against six important currencies fails to support the positive US Treasury bond yields and the dollar’s status as a safe haven. Despite this, the yield on the standard US 10-year Treasury bond increased to 3.79%, its highest level in five weeks, while the yield on its two-year counterpart advanced to 4.52% at the latest. According to the most recent report from the Organisation for Economic Co-operation and Development, released on Wednesday, persistent core inflation and tighter monetary policy will weigh on demand in the coming years, resulting in a weak recovery for the global economy. It should be noted that the looming concerns over a potential $1.0 bond issuance by the US Treasury Department as a result of the debt-ceiling agreement also influence market sentiment, drag down the bond price, raise yields, and put a floor under the DXY.
In a similar vein, dismal data from China and the US support concerns about a global recession and combine with worries about key central banks raising interest rates to dampen risk appetite and strengthen the US Dollar. Additionally, according to the 10-year and 5-year breakeven inflation rates from the St. Louis Federal Reserve data, US inflation expectations have increased to their highest levels in a week, teasing both Fed doves and buyers of the US Dollar Index. In contrast, the market increased its bets on the Federal Reserve raising interest rates by 25 basis points in July, even though the Federal Open Market Committee (FOMC) meeting in June is expected to keep rates unchanged. The US Dollar Index is under pressure during a sluggish session as the same data joins recently disappointing US data. The US weekly Initial Jobless Claims will be watched in the future for any clear indications. However, since the most recent shift in the market’s sentiment weighs on the risk-barometer pair, special attention should be paid to the yields and risk catalysts.
EURGBP Analysis

EURGBP is moving in an Ascending channel and the market has reached the higher low area and horizontal support area of the Consolidation pattern inside the Channel.
Lower German industrial data and a smaller May trade surplus for China keep the euro weaker against other currency pairs. The ECB is very well supported in its efforts to control inflation, and policymakers at the next meeting are more likely to raise interest rates by 25 basis points.
This morning on Wednesday, the euro is down against the dollar once more due to a significant miss on the Chinese balance of trade for May, which highlights sluggish global demand. The euro selloff is due to the euro’s historical positive correlation with the Chinese economy. In addition, German industrial production echoed similar sentiments by missing forecasts and escalating recessionary fears Recent data on inflation and PMI have also shown that the eurozone’s economy is slowing down. Another negative factor for the currency that appears to persist at least temporarily is the deteriorating situation in Ukraine, which supports the appeal of the dollar as a safe haven.
With several ECB speakers scheduled for today, the hawkish narrative may be supplemented. The ECB has been one of the only advocates for the euro. The aggressive process has already begun with Schnabel of the ECB declaring that there is still more ground for the central bank to cover. The ECB will almost certainly increase rates by 25 basis points next week and may leave the door open for additional monetary policy tightening, according to the current money market pricing shown below.
OECD report shows UK Growth will be 0.30% in 2023 and 1.0% in 2024 and it is higher than previous forecasts of -0.20% in 2023 and 0.9% in 2024. UK PM Rishi Sunak fails to speak about the US -UK Free trade deal during his diplomatic visit to the US.
GBPJPY Analysis

GBPJPY is moving in the Box pattern and the market has reached the resistance area of the pattern.
Japan’s Q1 GDP data decreased from a 0.50% expansion and a previous reading of 0.40% to 0.30%.After the report was released today, the Japanese yen fell. GDP for the Eurozone in Q1 is predicted to remain unchanged at 1.2% from Q4’s 1.3%.
The EURJPY increased at the start of Thursday’s Asian session after Japan released strong current account data but a trade balance deficit. Additionally, the Gross Domestic Product for Q1 unexpectedly shrank. The EUR/JPY then slightly rose to around 149.88 in response. GDP figures from the Eurozone could have an additional effect on the pair for the remainder of the session. While markets had anticipated a 0.5% increase from the previous quarter’s 0.4% reading, the Japanese Cabinet Office reported that the GDP dropped by 0.3% in the first quarter. However, the annualised rate increased from its prior 1.6% level to 2.7%. In addition, the Ministry of Finance reported a trade balance deficit of 113.1 billion but a current account surplus of 1,895 billion, which was better than expected. The EZ will release GDP data for Q1 on Thursday, and it is anticipated that the quarterly reading will have remained unchanged and that the annualised rate will have slightly slowed from 1.3% to 1.2%.
GBPCAD Analysis

GBPCAD is moving in the Box pattern and the market has reached the horizontal support area of the pattern.
The UK Permanent Staff Member Recruitment is Weak Since April 2021 and Starting Salaries for Permanent Staff Were Decreased Since 2021, according to a report from the UK’s Recruitment and Employment Confederation (REC) Funded by Giant KPMG. According to this report, the UK economy’s labour market is cooling, necessitating further rate increases by the Bank of England at upcoming meetings.
Britain’s labour market continued to cool in May as starting salaries for permanent staff increased at the slowest rate in more than two years, according to the most recent survey from the UK’s Recruitment and Employment Confederation, which is funded by the global quant giant KPMG. It should be noted that the Bank of England is closely monitoring the recruiters who participated in the survey, making the results seem more significant for traders of the GBPUSD pair. As its indicator of staff demand dropped to a five-month low, REC reported that the number of permanent staff placements decreased last month at the sharpest rate since January 2021. The survey corroborated other indicators of the labour market that clearly show it is now loosening. The rate of increase in starting salaries for permanent employees as measured by REC decreased to its lowest level since April 2021, but it was still described as “a historically sharp pace overall” by the organisation.
CADCHF Analysis

CADCHF has broken the Descending channel in upside..
UBS postponed the release of its quarterly results from July 25 to the end of August. The merger of the Credit Suisse acquisition in June was the driving force behind this deal.
On Wednesday, UBS announced that it had postponed the release of its second quarter results until August 31.The nation’s largest bank, which is currently wrapping up its acquisition of rival Credit Suisse, had originally scheduled its earnings announcement for July 25. According to a report from the Financial Times on Sunday, UBS was considering delaying the release of its quarterly results at least until the end of August as it deals with takeover-related complications.
AUDNZD Analysis

AUDNZD is moving in an Ascending channel and the market has reached the higher high area of the channel.
Kiwis were disappointed by lower-than-expected data on China’s trade surplus in May, and the RBNZ increased interest rates more than it had in any previous year since 1999.The US dollar is now secure. The US debt ceiling has been raised through January 2025.
The market’s sentiment is still precarious in the wake of the deteriorating global economic conditions. Chinese trade data released on Wednesday revealed that the surplus fell to a 13-month low in May as a result of a decline in exports, which raised new concerns. The data showed weak overseas demand for Chinese goods, which presents problems for the biggest economy on earth. This may have an impact on antipodean currencies, such as the Kiwi, and help to stabilise the NZDUSD pair. This calls for caution before placing new bullish bets, along with the Reserve Bank of New Zealand’s explicit signal that it was finished with its most ferocious hiking cycle since 1999. Therefore, it will be wise to hold off on positioning for the NZDUSD pair’s recovery from the YTD low, levels just below the 0.6000 psychological level touched last week, until there is strong follow-through buying. The release of the US Weekly Initial Jobless Claims data is now anticipated by market participants.
AUDCHF Analysis

AUDCHF is moving in the Box pattern and the market has reached the resistance area of the pattern.
Aussie moves positively against the US dollar after the RBA’s unexpected 25 bps rate hike. Australian GDP came in lower than anticipated, causing a slight decline in economic growth. Contrary to expectations, 0.20% was printed. GDP fell in Q1 by 2.3% instead of the expected 2.4%. Due to a respectable rise in Australian domestic demand, the trade surplus decreased.
The AUD pair has shown a less assured recovery. As gains spurred by a surprise interest rate hike by the Reserve Bank of Australia have begun to wane, the Aussie asset appears vulnerable to further losses. Significant losses were caused by S&P500 futures in Asia. On Wednesday, US equities carried over their pessimism, a sign of weakened market sentiment. Investors have become more cautious about the outlook for the US economy as expectations for the Federal Reserve to continue its policy-tightening cycle have grown. After a V-shaped recovery, the US Dollar Index has corrected below 104.00. Broadly speaking, until the publication of the US Consumer Price Index data, which will release next week, the USD Index is predicted to trade sideways. The May employment statistics are already available, and the latest inflation data will give the Fed’s interest rate decision more context.
On the Australian Dollar front, the impact of RBA Governor Philip Lowe’s unexpected 25 basis point increase in the interest rate to 4.10% has begun to quickly fade as the decision is being accompanied by weak economic indicators. Australia’s quarterly GDP increased by 0.2% despite market expectations for a 0.3% increase. In comparison to expectations of 2.4%, Q1 GDP fell to 2.3% on an annual basis. In addition, April’s Trade Balance data showed a sharp decline in the surplus due to weak export figures while an increase in imports, which suggested a healthy domestic demand. “Rising interest rates are clearly impacting the economic growth, Australian Treasurer Jim Chalmers stated on Wednesday. Growth momentum is waning, he told.
Don’t trade all the time, trade forex only at the confirmed trade setups.
Get Live Free Signals now: forexgdp.com/forex-signals/