Currently set to No Index
Skip to content
Wednesday, May 25, 2022
FOREX GDP

  • Forex Signals
  • Results
  • News Analysis
  • User reviews
  • FAQ
  • Brokers
  • EDUCATION
    • Change your Trading Mistakes
    • Low risk High Reward Strategy
    • Forex Chart Patterns
    • Courses
      • Basic Forex Course
      • Advanced Forex Course
    • Forex Basics
    • Forex Trading Guide
    • Forex Charts
    • Forex Scalping Signals
    • Forex Strategies
    • Forex Indicators
    • Types of Brokers
    • Forex Trading videos
    • Forex in Thai
    • தமிழ்
    • Calendar
  • About Us
  • Contact

audcad long term

  • +1380 Points Reached in AUDCAD buy signal after rebounding from the major support area

    img

    AUDCAD Analysis: AUDCAD is trying to rebound from the major support area in the daily timeframe chart. After the confirmation…

    Read more >>

  • +2300 Points reached in AUDCAD after breaking the top level of the channel line and trying to rebound from the retest zone

    img

    AUDCAD Analysis : AUDCAD has broken the top level of the channel line and trying to rebound from the retest…

    Read more >>

  • +1400 Points reached in AUDCAD after breaking the top level of the channel line and trying to rebound from the retest zone

    img

    AUDCAD Analysis : AUDCAD has broken the top level of the channel line and trying to rebound from the retest…

    Read more >>

  • +1360 Points reached in AUDCAD buy signal after forming higher highs and higher lows

    img

    AUDCAD Analysis: AUDCAD is moving in an ascending channel by forming higher highs and higher lows. Now the market has…

    Read more >>

  • +1050 Points reached in AUDCAD Signal after retesting and rebounding from the broken level

    img

    AUDCAD Analysis: AUDCAD has broken the top of the major descending channel. After breakout, market has retested the broken level…

    Read more >>

  • +2070 Points Reached in AUDCAD after rebounding from the lower lows of the descending channel line and from the major support area

    img

    AUDCAD Analysis AUDCAD is standing exactly at the major support area in the weekly timeframe chart. In the 4-hour timeframe,…

    Read more >>

  • +1770 Points Reached in AUDCAD after reaching the higher low of an uptrend line

    img

    AUDCAD Analysis AUDCAD has reached the higher low of an uptrend line in the 1-hour timeframe chart. In the 4-hour…

    Read more >>

  • +1370 Points Reached in AUDCAD after rebounding from the lower lows of the descending channel line and from the major support area

    img

    AUDCAD Analysis AUDCAD is standing exactly at the major support area in the weekly timeframe chart. In the 4-hour timeframe,…

    Read more >>

  • +1120 Points Reached in AUDCAD after reaching the higher low of an uptrend line

    img

    AUDCAD Analysis AUDCAD has reached the higher low of an uptrend line in the 1-hour timeframe chart. In the 4-hour…

    Read more >>

  • +1470 Points Achieved in AUDCAD Buy signal

    img

    AUDCAD Analysis: AUDCAD has broken the top level of the downtrend line in the 4-hour timeframe chart. Now the market…

    Read more >>

  • AUDCAD fall down from the lower high zone made +1748 Points

    img

    AUDCAD Sell Signal Analysis AUDCAD is moving in a downtrend by forming lower highs and lower highs. After AUDCAD reaching…

    Read more >>

  • AUDCAD starts to fall from the Strong Resistance in Daily Chart

    img

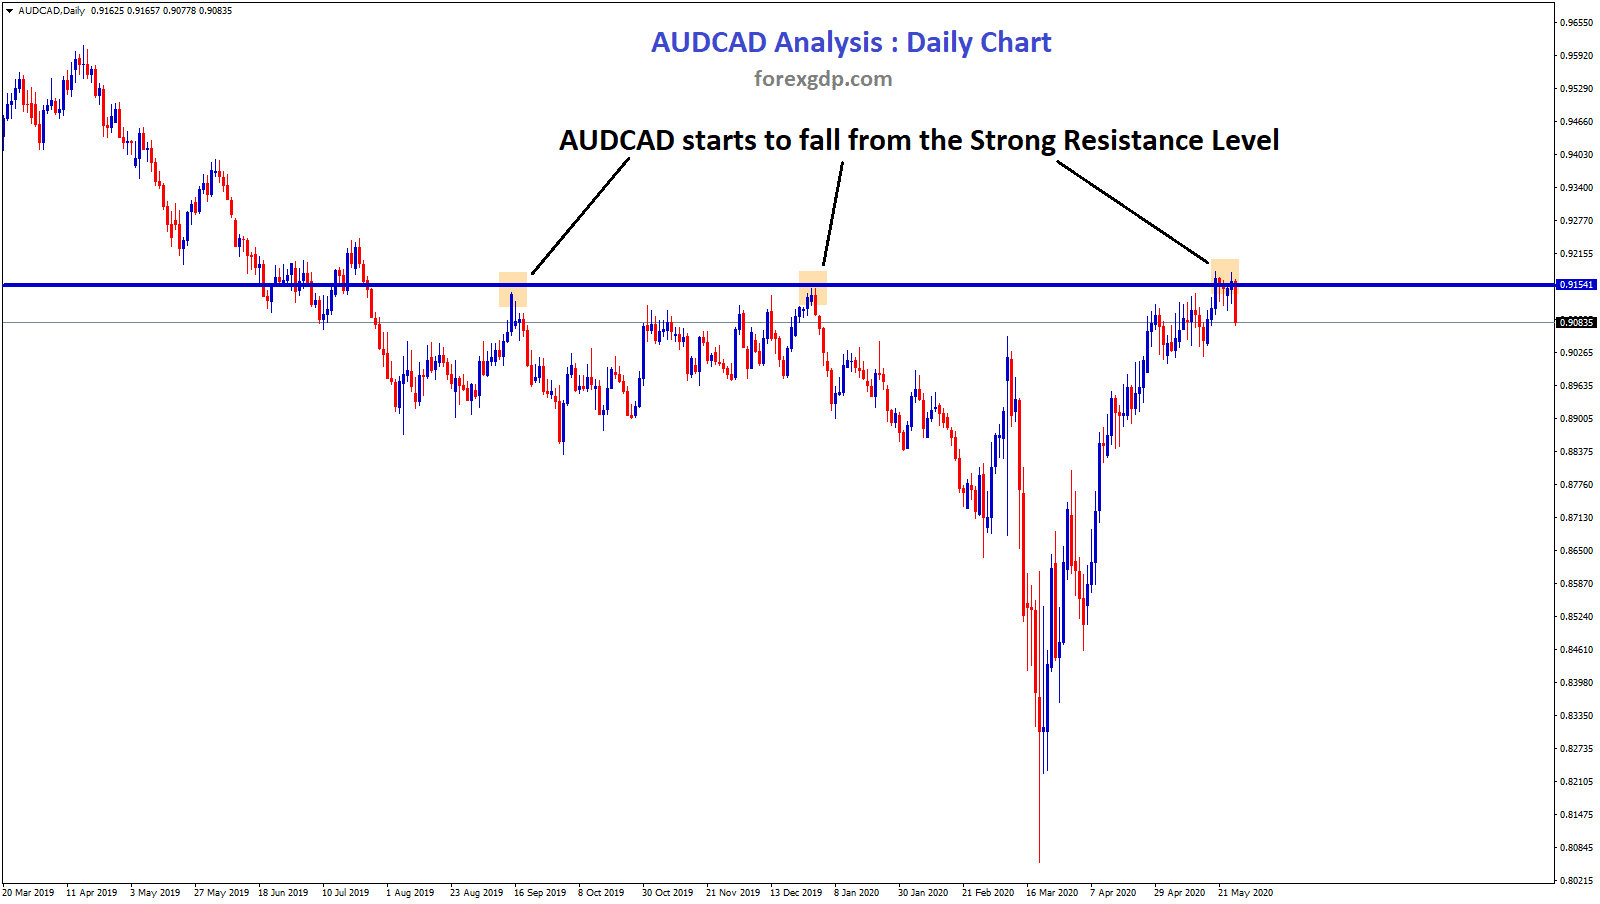
    AUDCAD Resistance Level analysis AUDCAD is standing at the Strong Resistance level for long time. Now market starts to fall…

    Read more >>

  • AUD/CAD reached the bottom level harder, Wait for reversal or breakout?

    img

    AUD/CAD Analysis :  AUD/CAD is moving up and down for long time between the specific price ranges. Now, market has…

    Read more >>

  • AUD/CAD trying hard to break the strong support level

    img

    AUD/CAD Analysis :  AUD/CAD is moving up and down between the specific price levels for a long time. Now, AUD/CAD…

    Read more >>

  • AUD/CAD reached the Strong Support Level. Waiting for Breakout ? or Reversal ?

    img

    AUD/CAD Analysis :  AUD/CAD has reached the Strong Support level in Weekly Chart. Let's wait for the confirmation of Breakout…

    Read more >>

  • +1282 Points Reached in AUD/CAD Sell Signal

    img

    Reason for Selling AUD/CAD :  1. AUD/CAD was moving up and down between the Resistance and Support ranges in H4…

    Read more >>

  • +4180 Points AUD/CAD went up after hitting the strong bottom zone in 2018

    img

    AUD/CAD Analysis Update (For Education Purpose): As per our Previous post on AUD/CAD (click here to see), we have explained…

    Read more >>

  • After 3 years, AUD/CAD reached the bottom level. Wait for Reversal or Breakout ?

    img

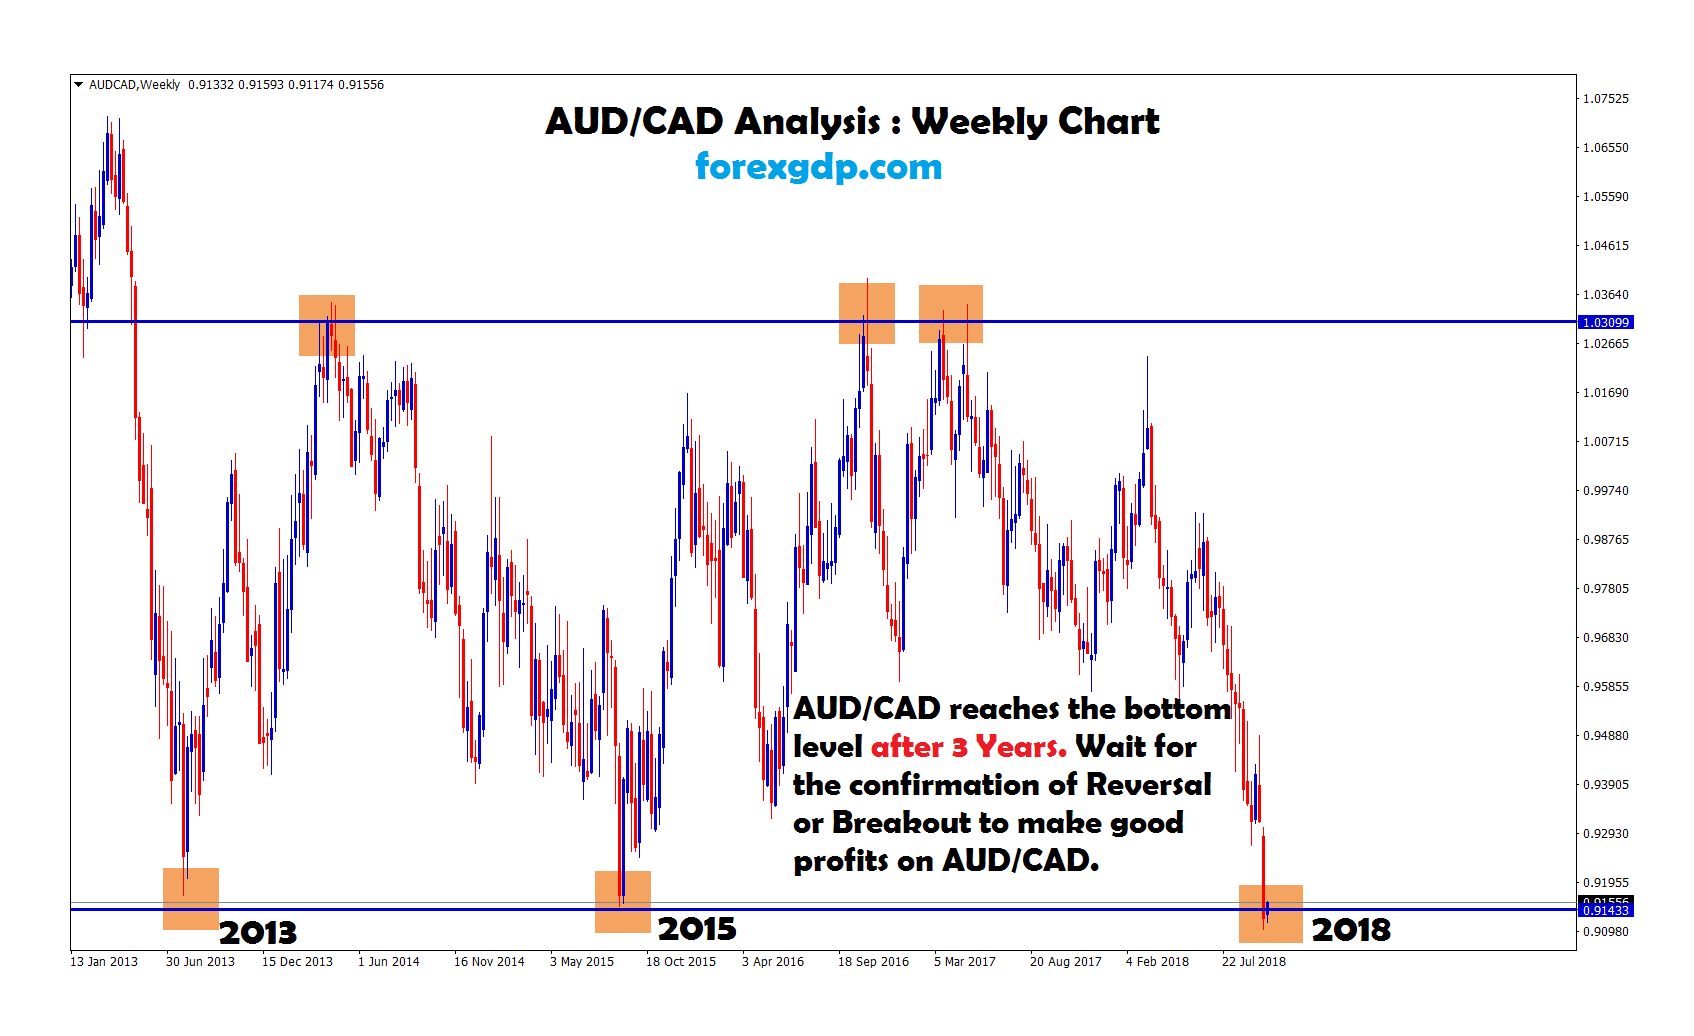
    AUD/CAD Analysis :  AUD/CAD reached the bottom level after a long time of 3 years. Previously, AUD/CAD reached this 3…

    Read more >>

  • +1443 Points Profit Reached Successfully in AUD/CAD Sell Signal
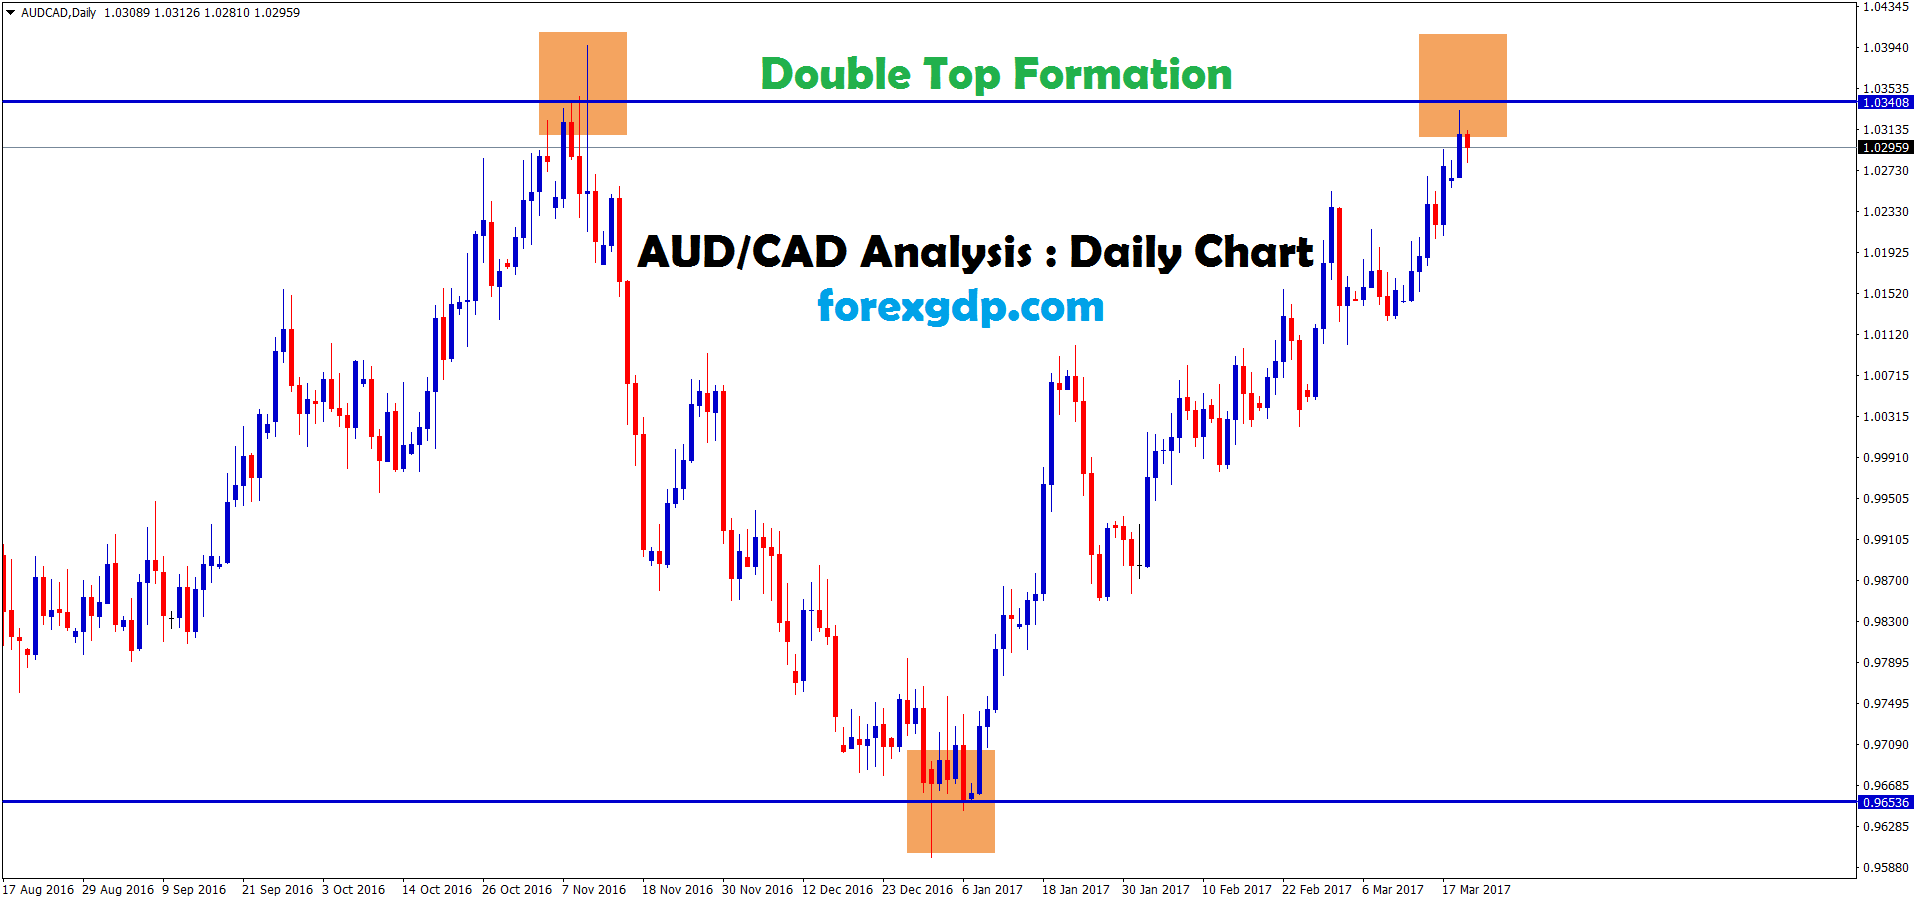
    img

    Reason for Selling AUD/CAD : AUD/CAD was moving up and down between the ranges for long time in H1 Chart.…

    Read more >>

  • +1254 Points Profit made Successfully in AUD/CAD Buy Signal

    img

    Reason for Buying AUD/CAD :  AUD/CAD reaches the strong support zone after long time and it starts to bounce back…

    Read more >>

    • 1
    • 2
    • Next »

Get Free Forex Signals now on !

Telegram Forex Signals Whatsapp Forex Signals Instagram Forex Signals Facebook Forex Signals Twitter Forex Signals Youtube forex signals

Open Free Trading Account

Exness broker review

About Us

Best sites to get payday loans online with no credit checks. FOREX GDP started by 20+ years Experienced Traders team who was worked with Major banks, Financial Institutions, Liquidity providers, Forex brokers in different job positions such as Equity Dealer, Fund Manager, Senior Market Analyst, Risk Manager and other major roles in Forex Trading Companies.

Products

  • FREE Forex Course
  • Forex Educatin Videos
  • Forex Trading Course
  • Advertise with us

Info

  • Live Economic Calendar
  • Types of Forex Broker
  • Indices Live Chart
  • Terms of Service

Analysis

  • Short Term Analysis
  • Long Term Analysis
  • Analysis Videos
  • Latest Updates
Personal Loans: Which is Less Riskier and Secure?

Copyright © 2022 FOREX GDP. All rights reserved.

  • STRICTLY EDUCATION SERVICES ONLY
  • Disclaimer | Terms & Conditions

75% Special Offer for Forex Signals

Get now
X