
Long Term Trade Analysis
Long Term Forex Trade Signals, Analysis on all Forex Currency pairs, Commodities, Metals, Binary Options, CFD’s, stocks and shares. Get Live Free Long term Forex Signals, Click here to join Free.
-
Gold starts to bounce back after hitting the old Breakout level
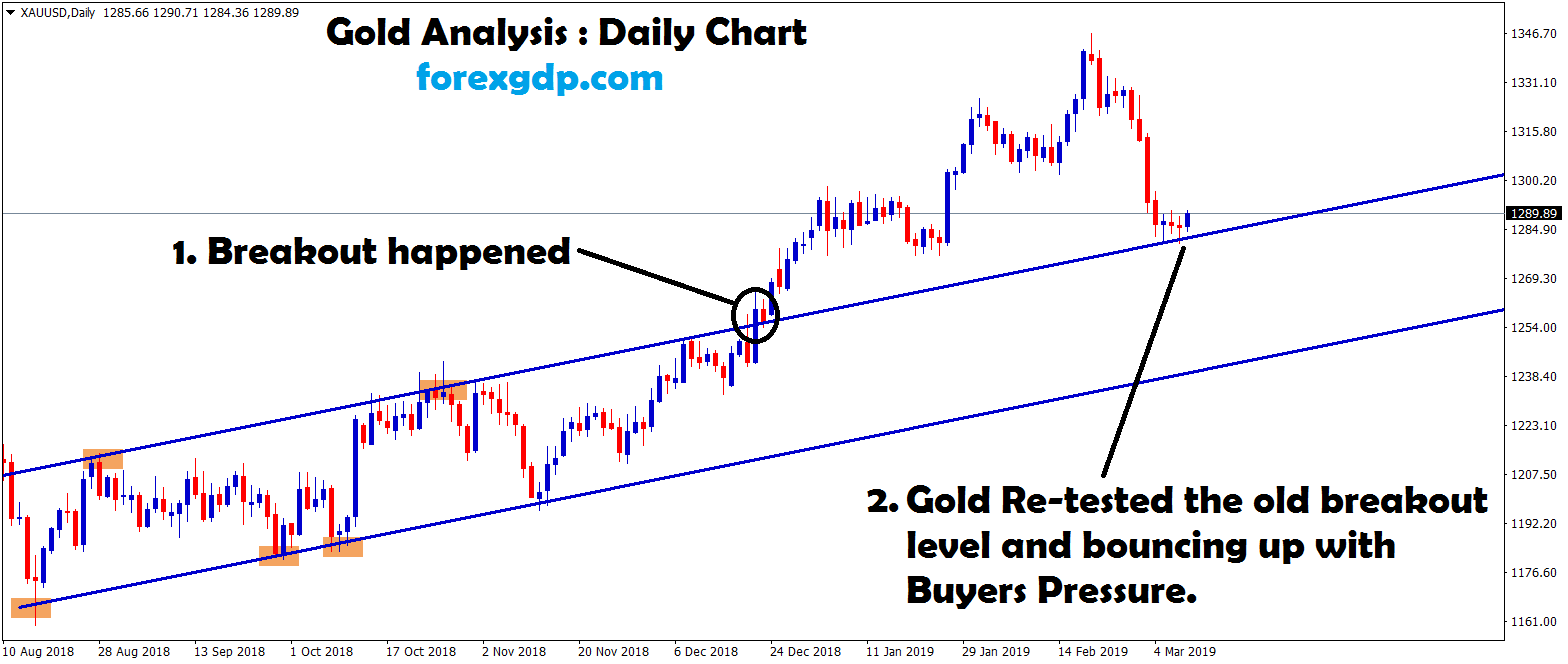
Gold Analysis (For Education Purpose): Gold has breakout the Uptrend ranging level before a long time. Gold hits the top…
-
Gold moving up continuously. Going to reach strong resistance zone
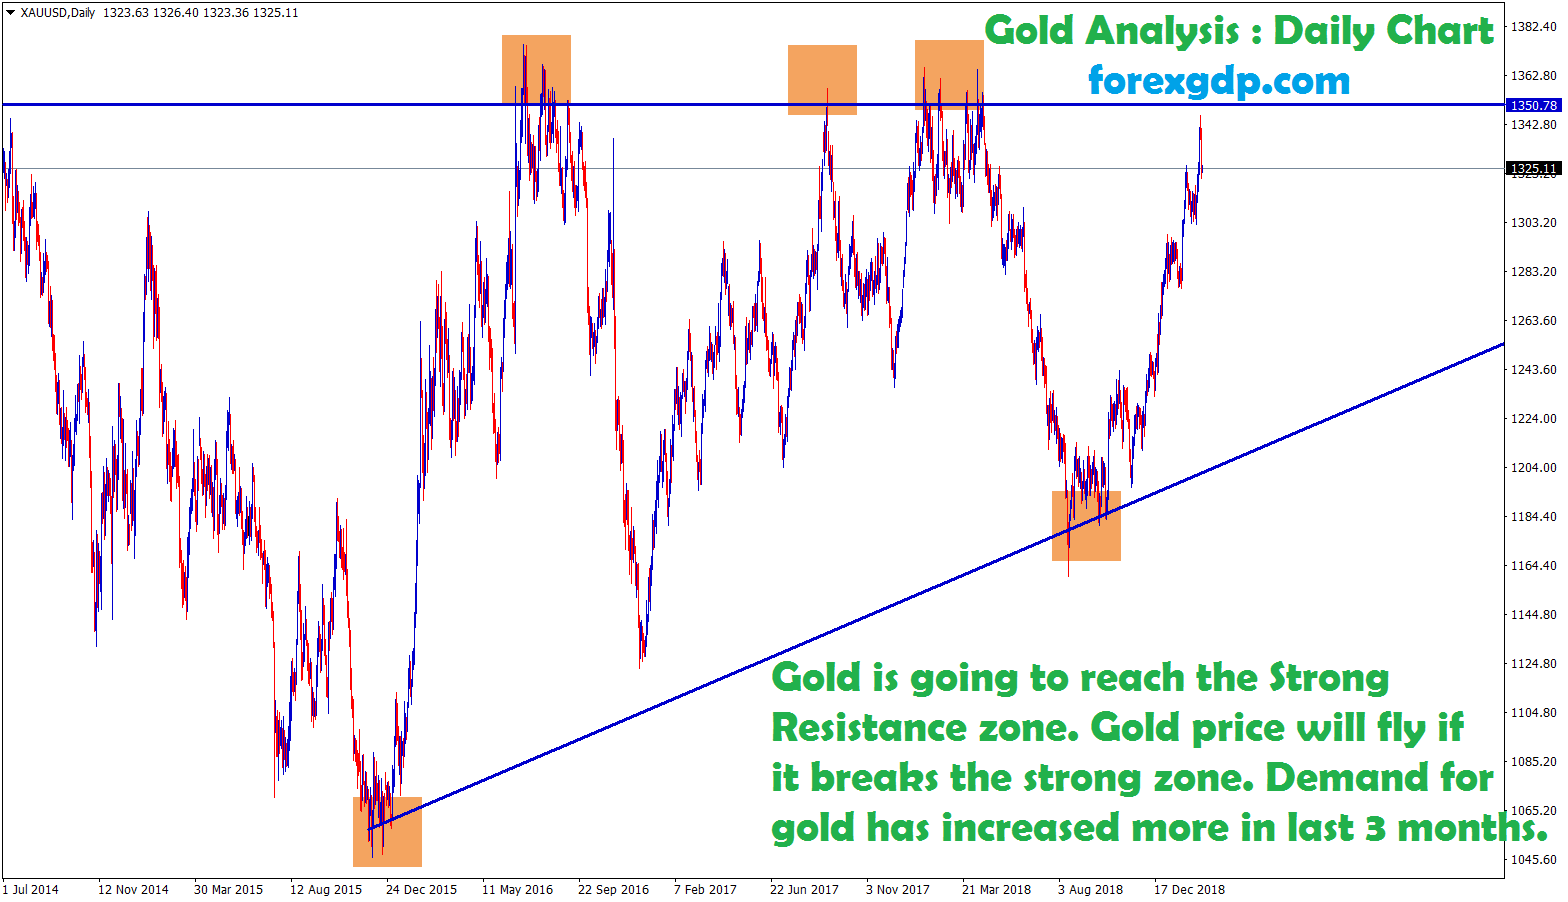
Gold Analysis (For Education Purpose): 1. Gold is going to reach the Strong Resistance zone. 2. Gold is moving in…
-
AUD/NZD Broken the bottom level of the range in Daily Chart
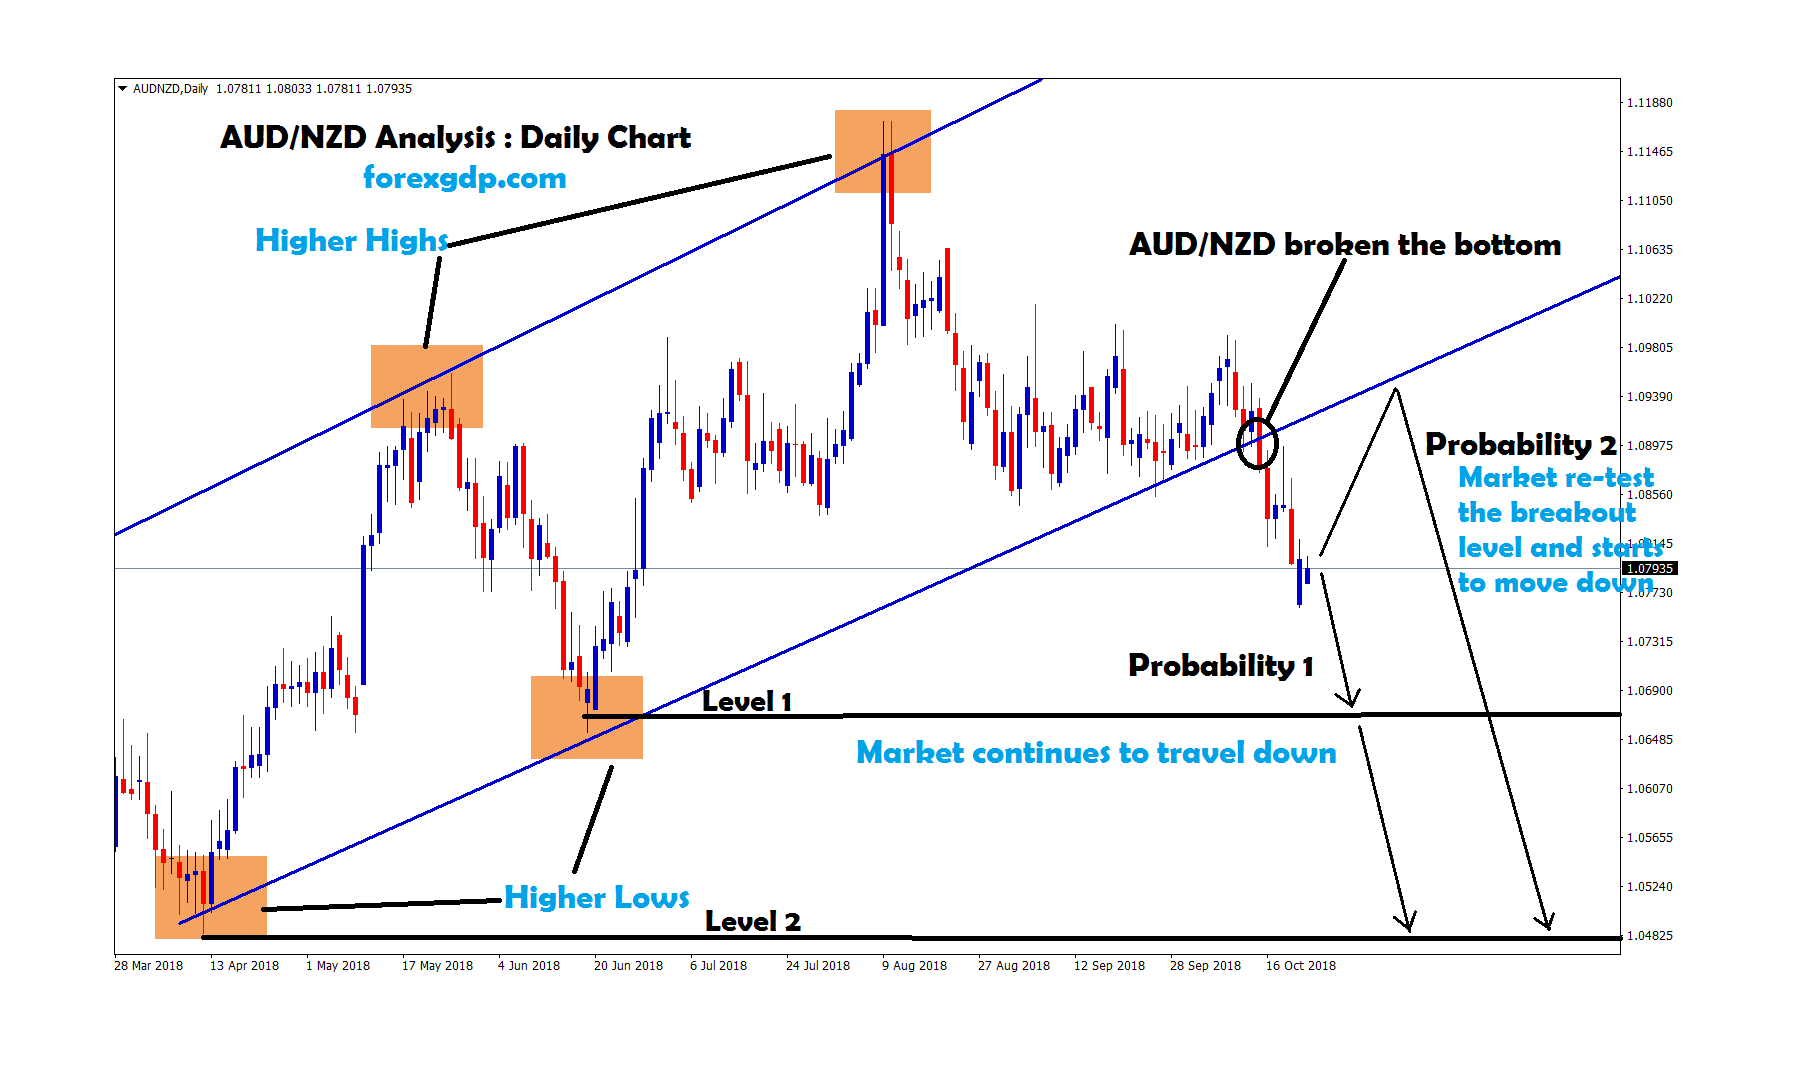
AUD/NZD Analysis : AUD/NZD was moving in an Uptrend by forming Higher Highs and Higher Lows in Daily Chart. Recently,…
-
After 3 years, AUD/CAD reached the bottom level. Wait for Reversal or Breakout ?
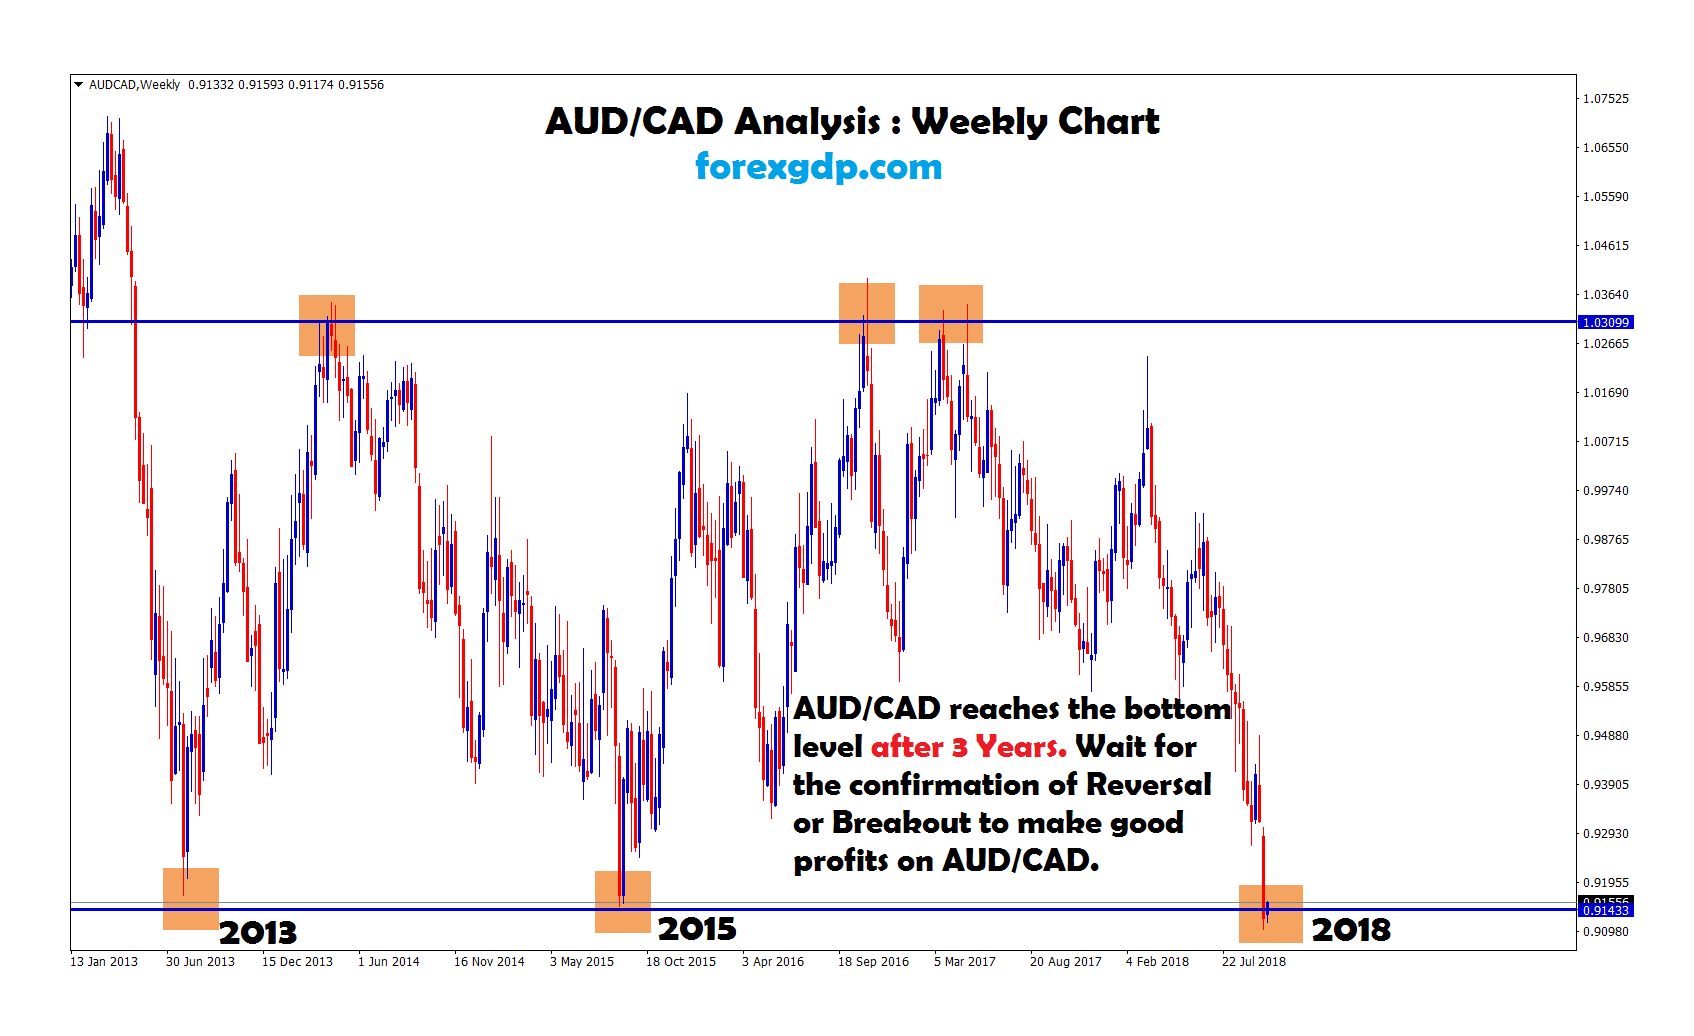
AUD/CAD Analysis : AUD/CAD reached the bottom level after a long time of 3 years. Previously, AUD/CAD reached this 3…
-
+7000 Points Gold went down after breakout happened at the bottom level. Exit gold trade with Good profits.
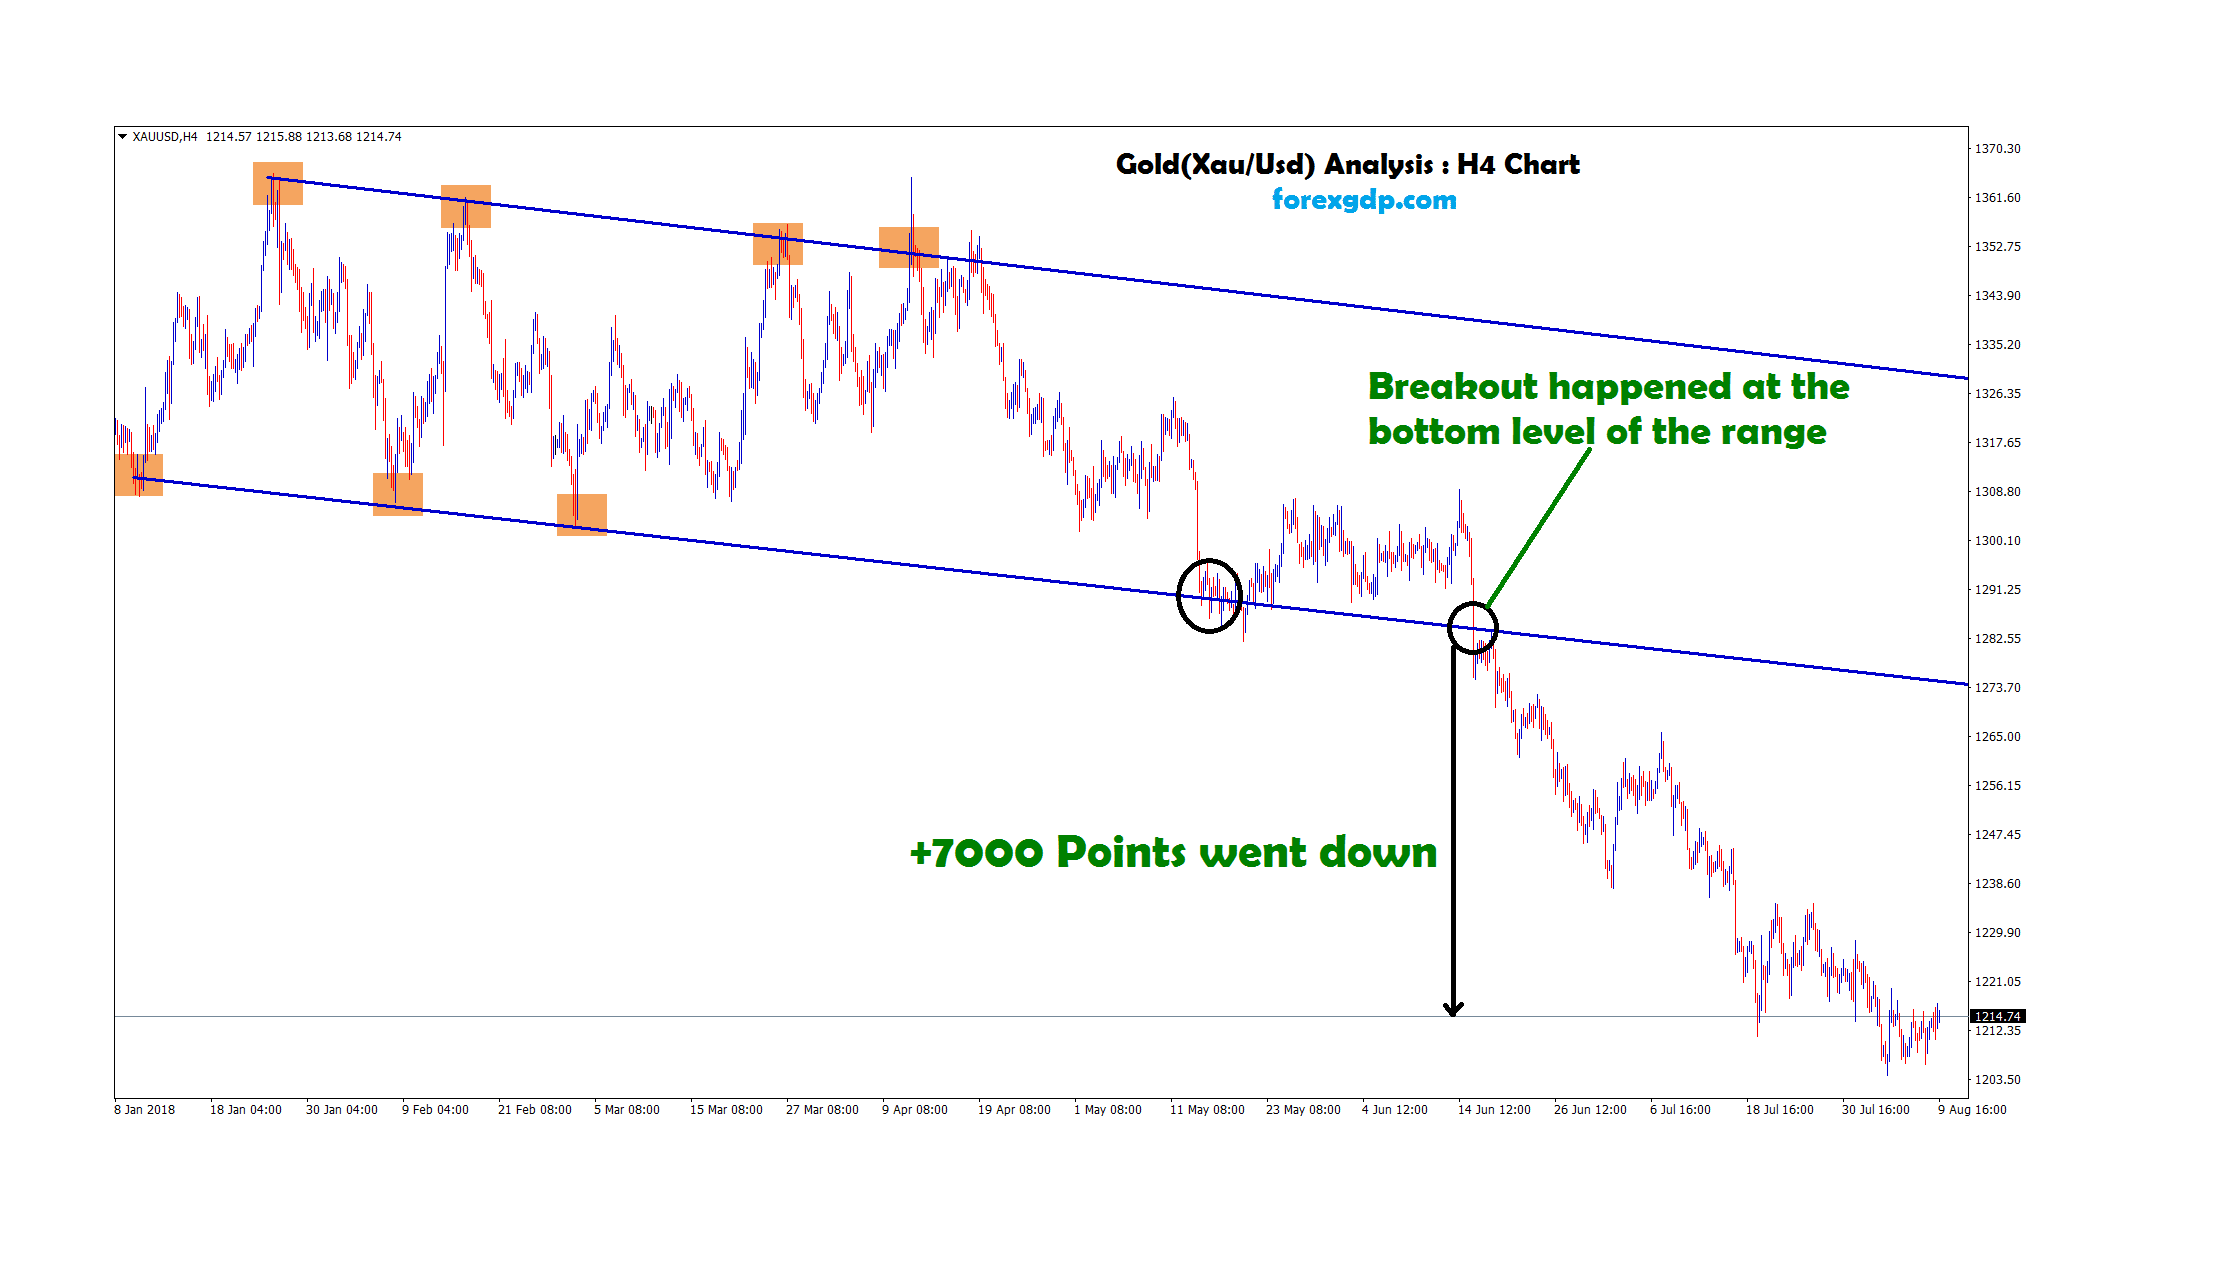
Gold Analysis : As per our Previous analysis (click here to see), Gold was moving between the ranges in H4…
-
Gold is moving up and down between the ranges. Wait for Breakout to make Big profits
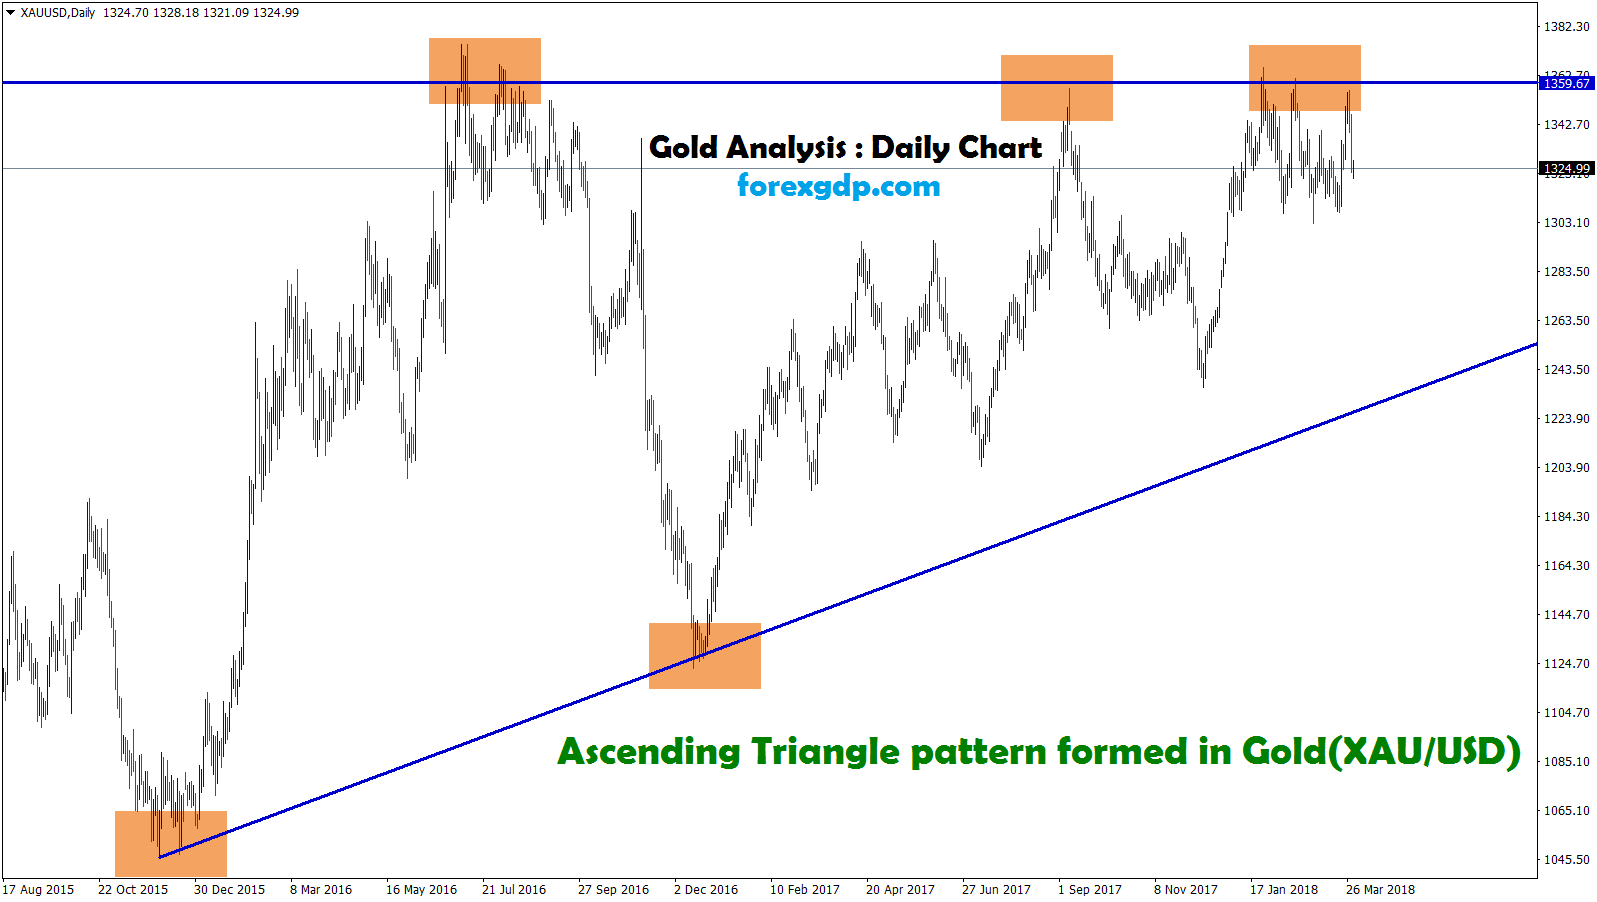
Gold (XAU/USD) Analysis : Gold is forming an Ascending triangle pattern in Daily Chart. Gold is moving up and down…
-
CAD/JPY bouncing up in Daily chart and Broken the top level of the range in H4 chart
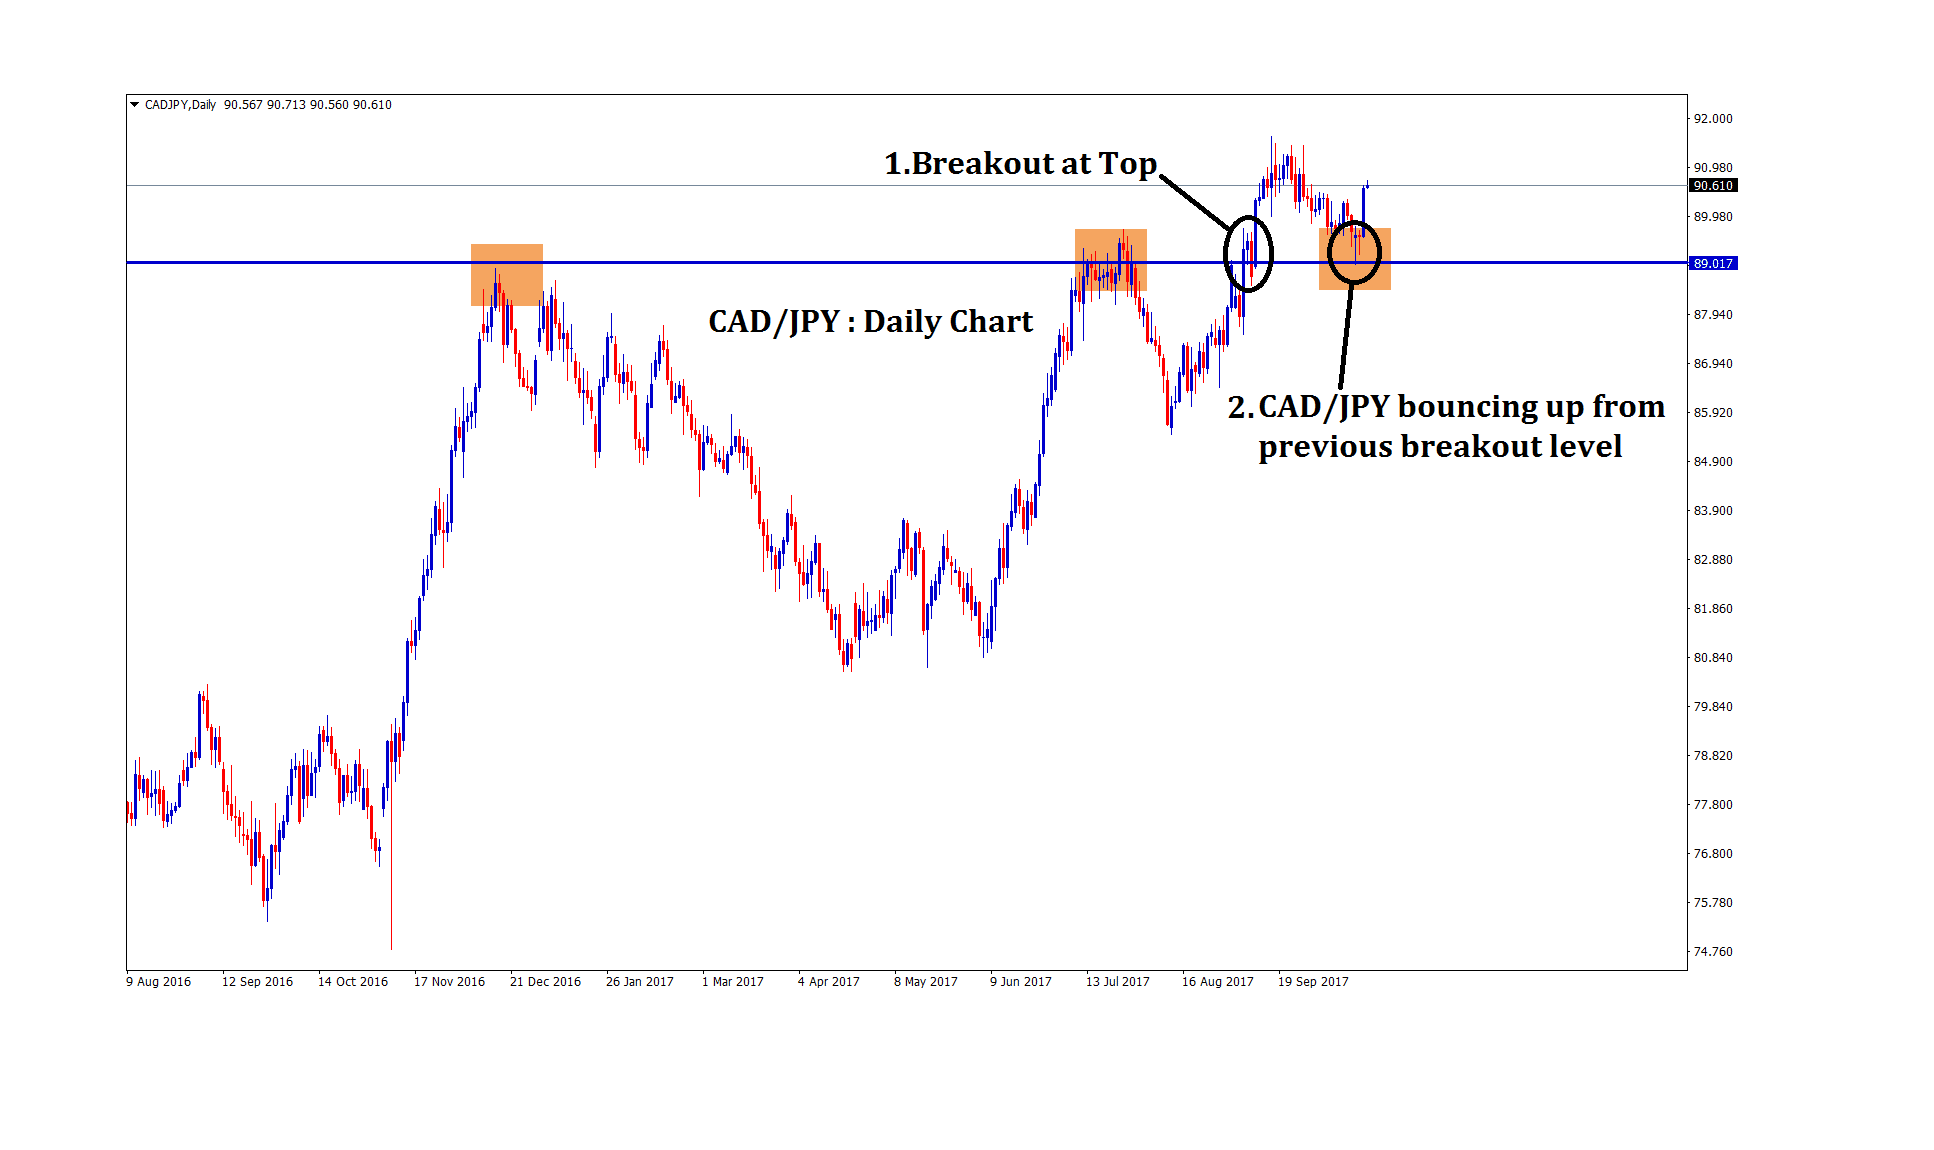
CAD/JPY Analysis : CAD/JPY bouncing up from the previous breakout level in Daily Chart. CAD/JPY broken the top level of the range…
-
Gold starts to fall down from the top price level 1292
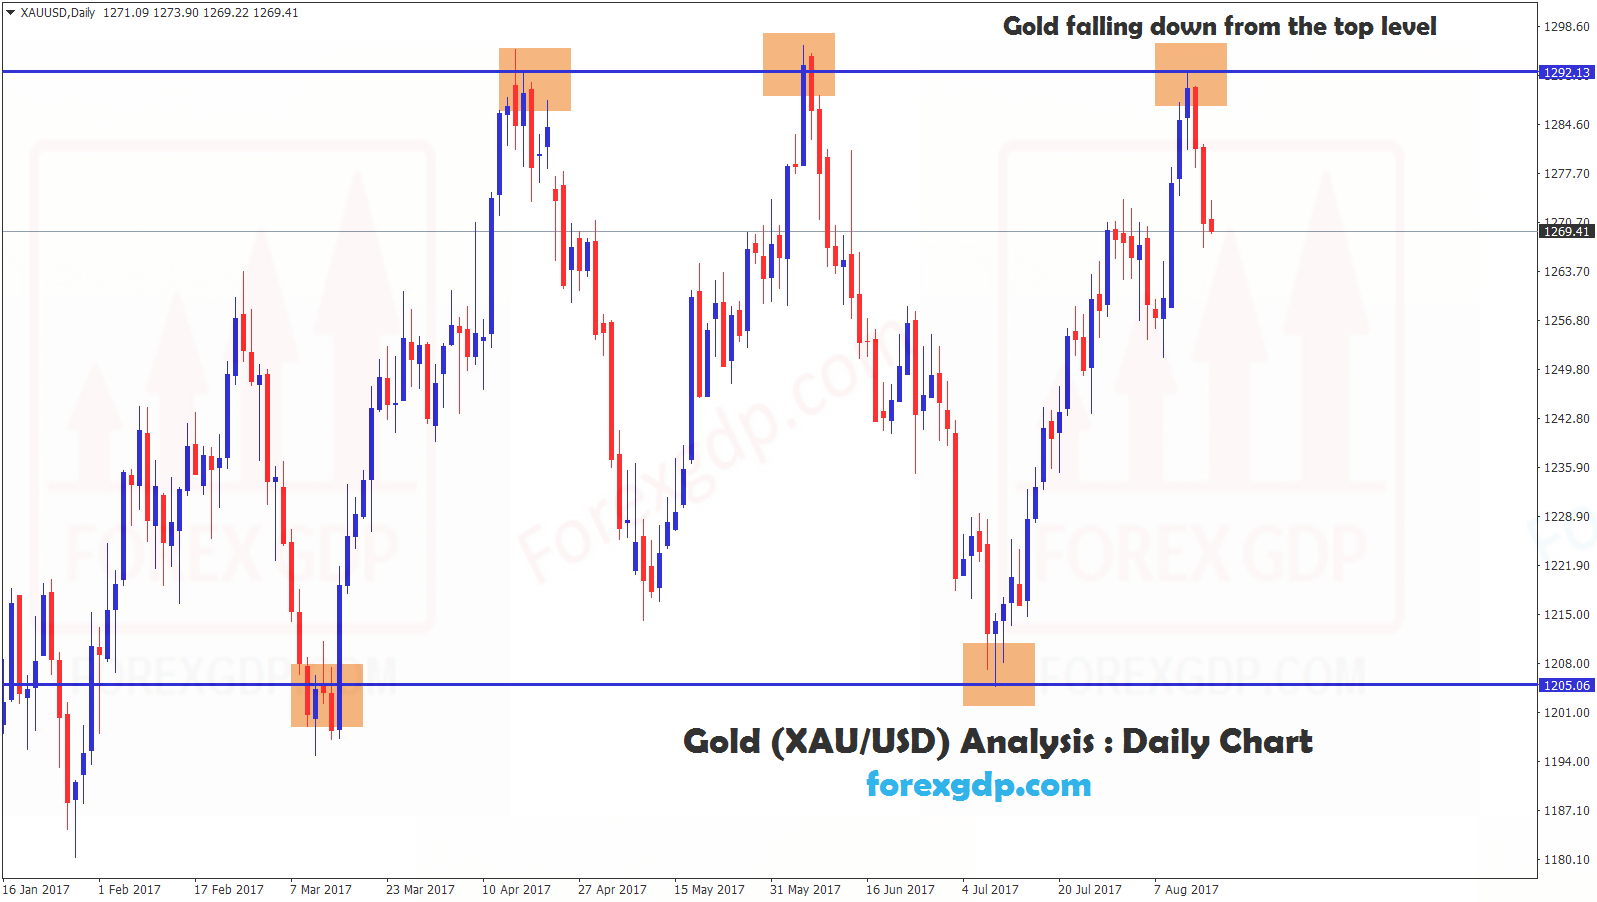
Gold (XAU/USD) Analysis : Gold is moving up and down between the ranges 1205 and 1292 for a long time.…
-
Long Term Analysis : USD/JPY Re-tested the Breakout Level and starts to move up
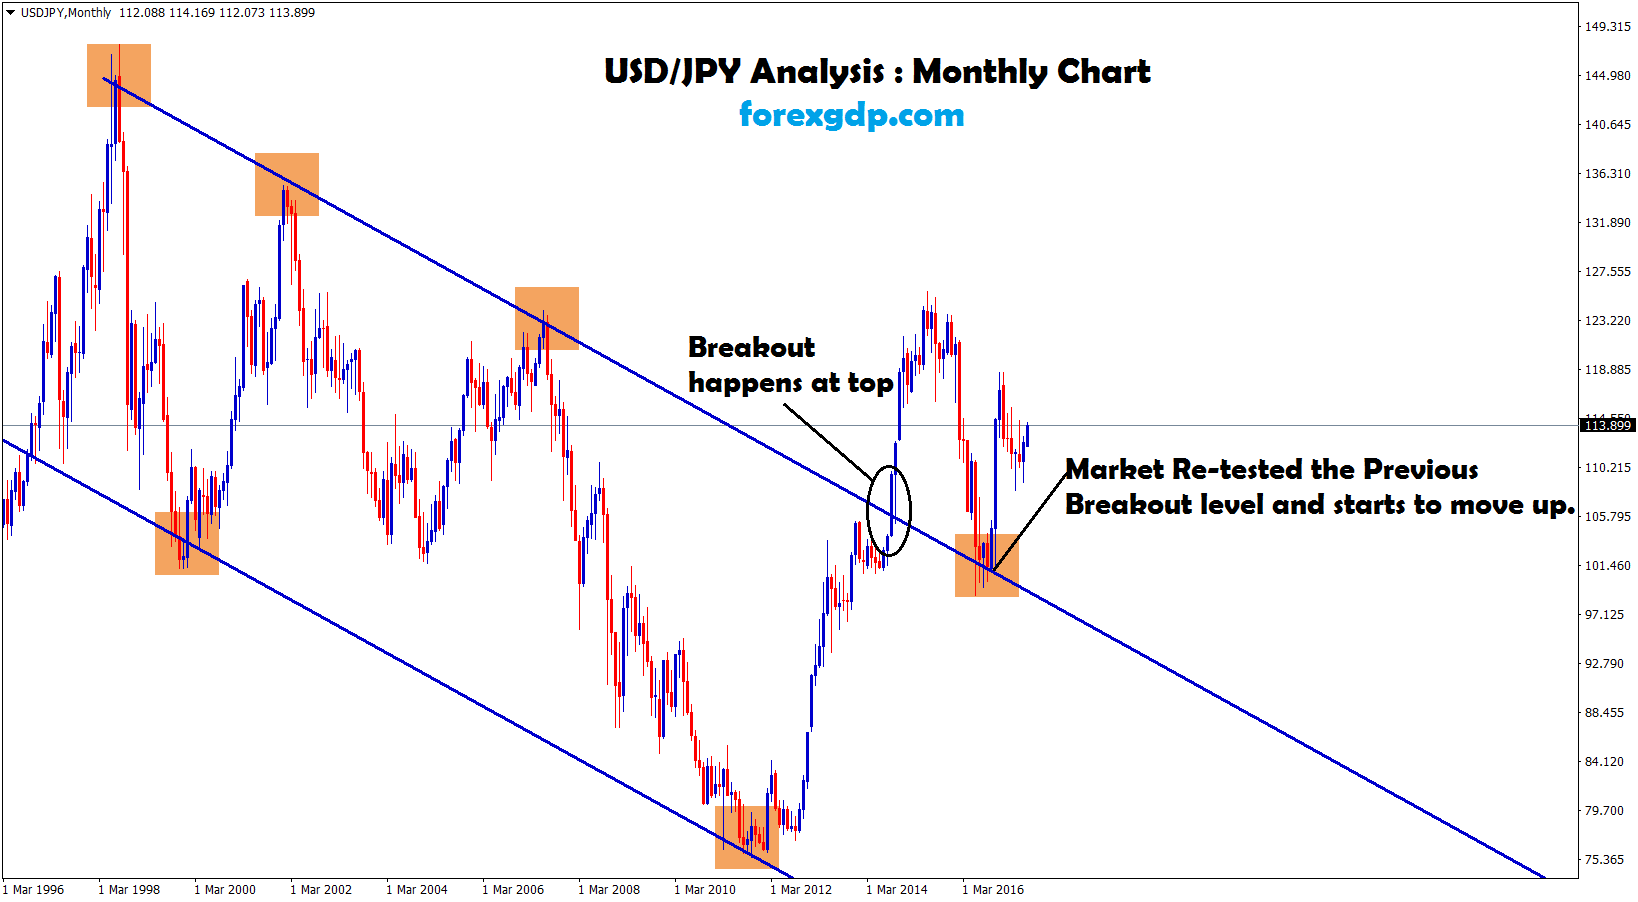
USD/JPY Analysis : USD/JPY was moving up and down between the ranges in Monthly Chart. On September 2014, USD/JPY breakout…
-
+2134 Points made in EUR/GBP Buy Setup
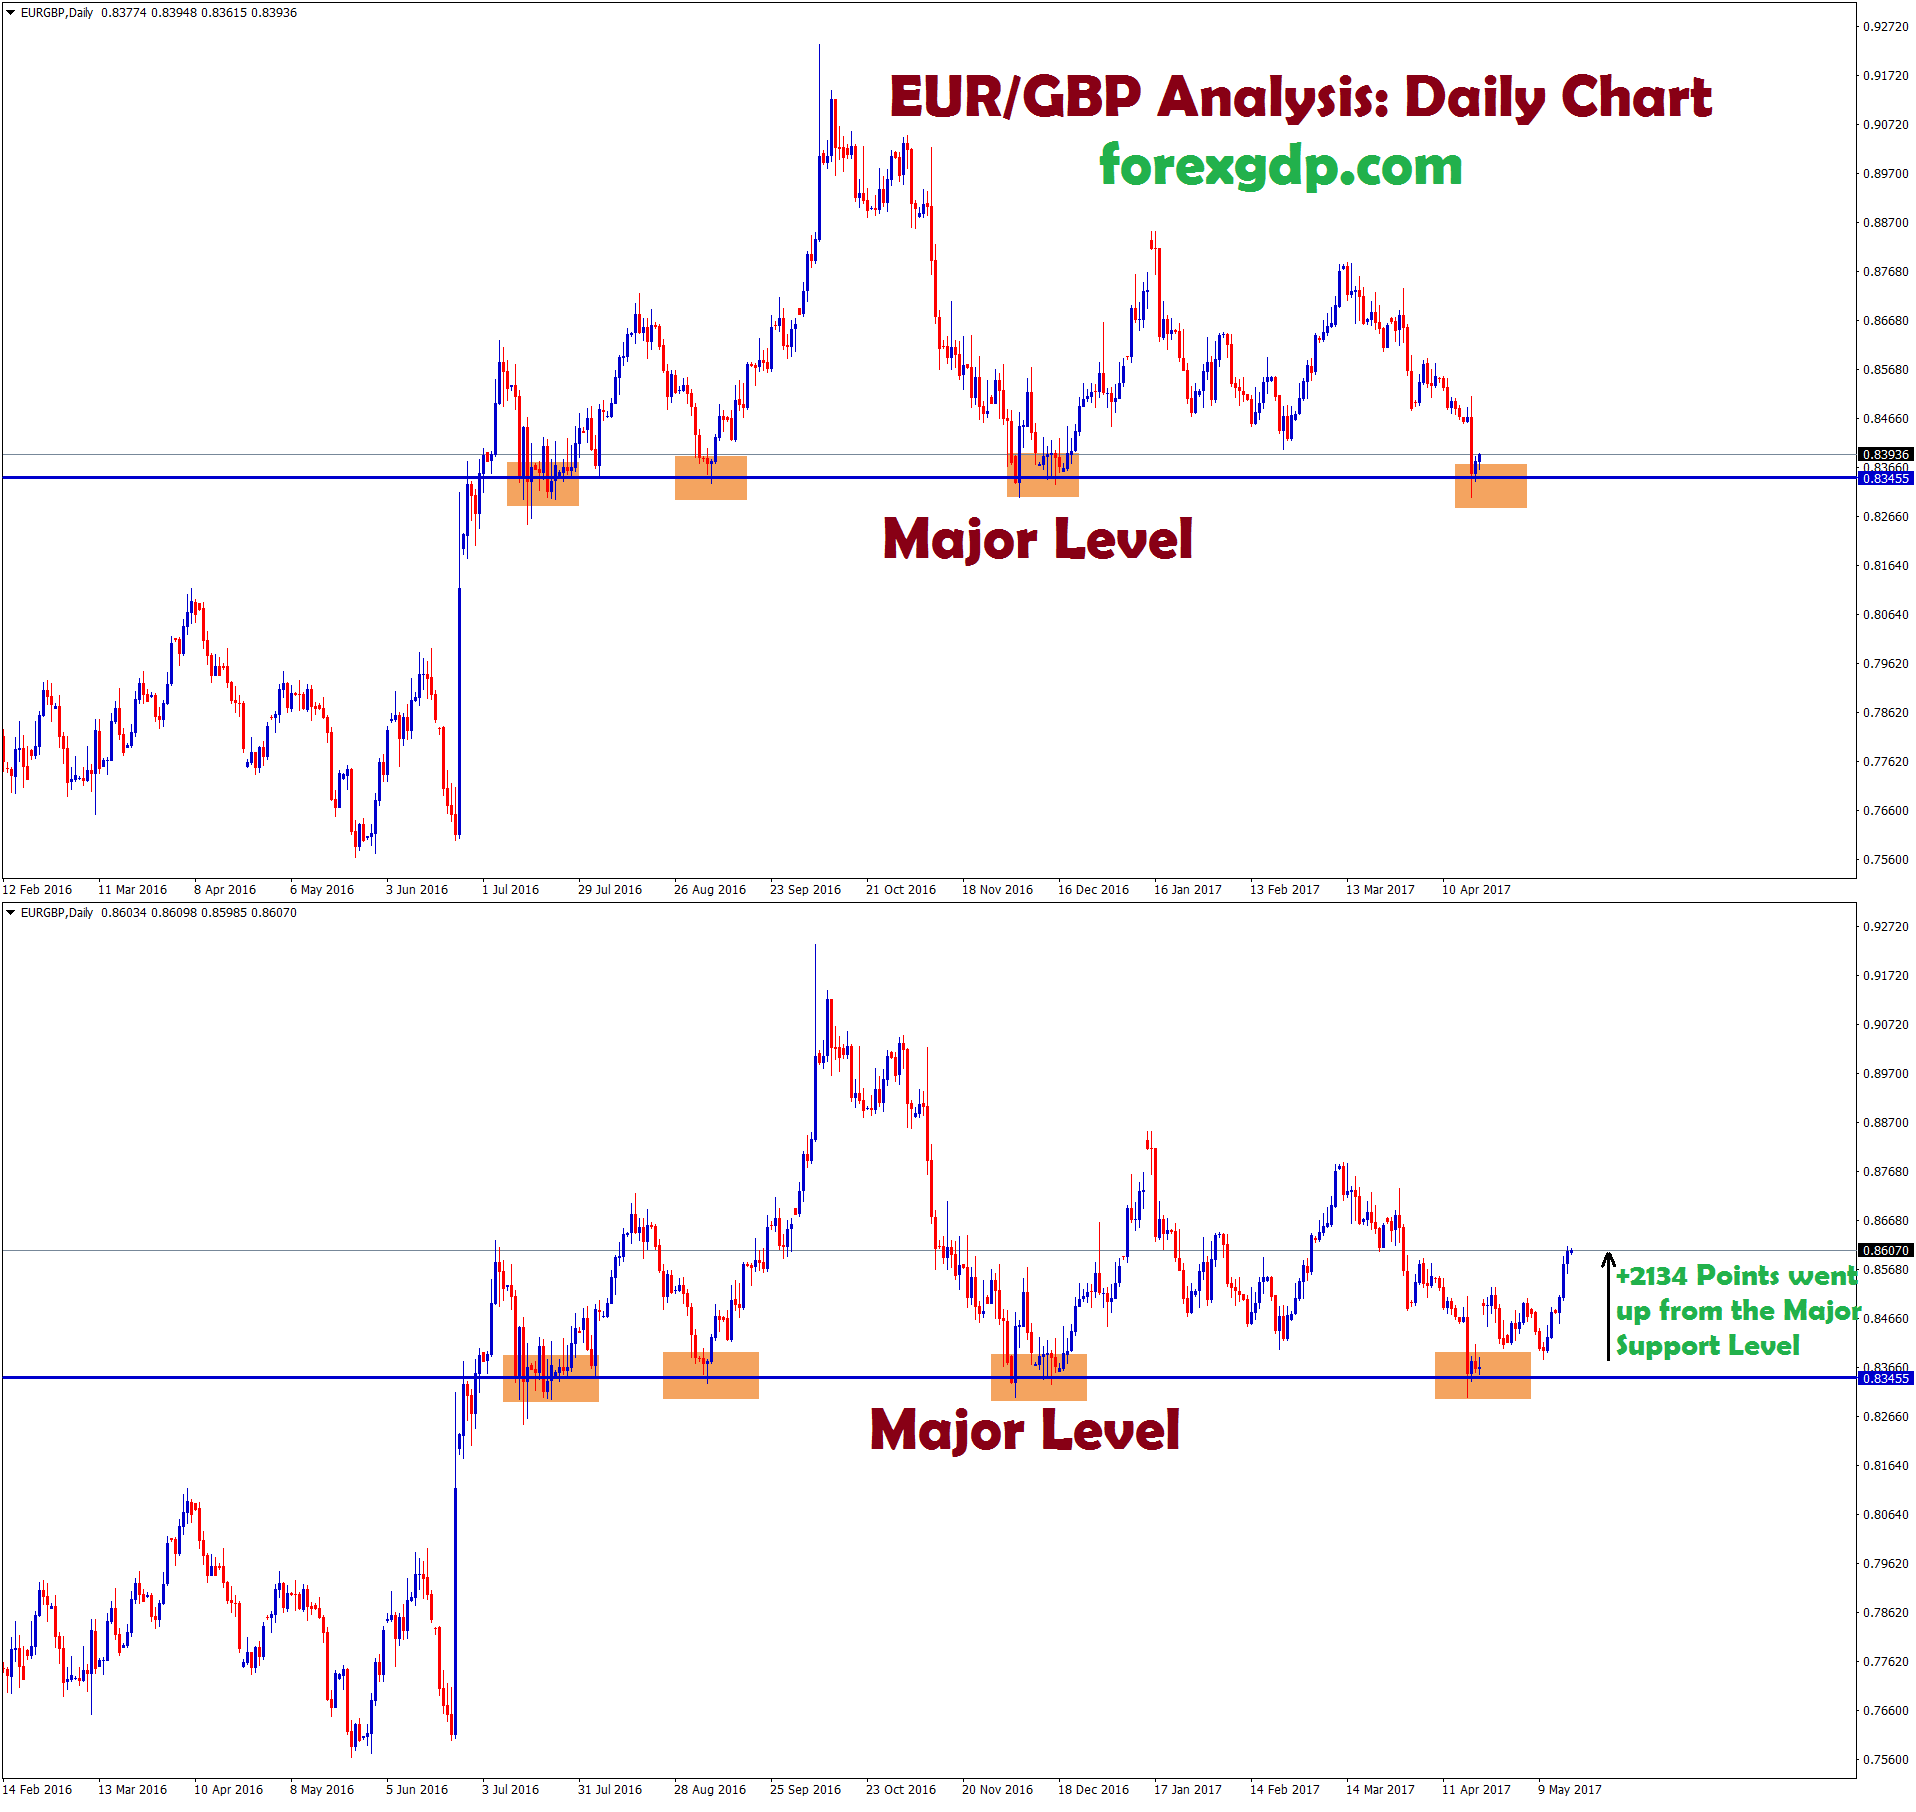
EUR/GBP Analysis : As per our Previous post on EUR/GBP, market reaches the major support level 0.83 for 4th time. U.K. Prime…
-
GBP/USD Re-tested the previous zone for 2 times, Wait for confirmation of Breakout (or) Reversal?
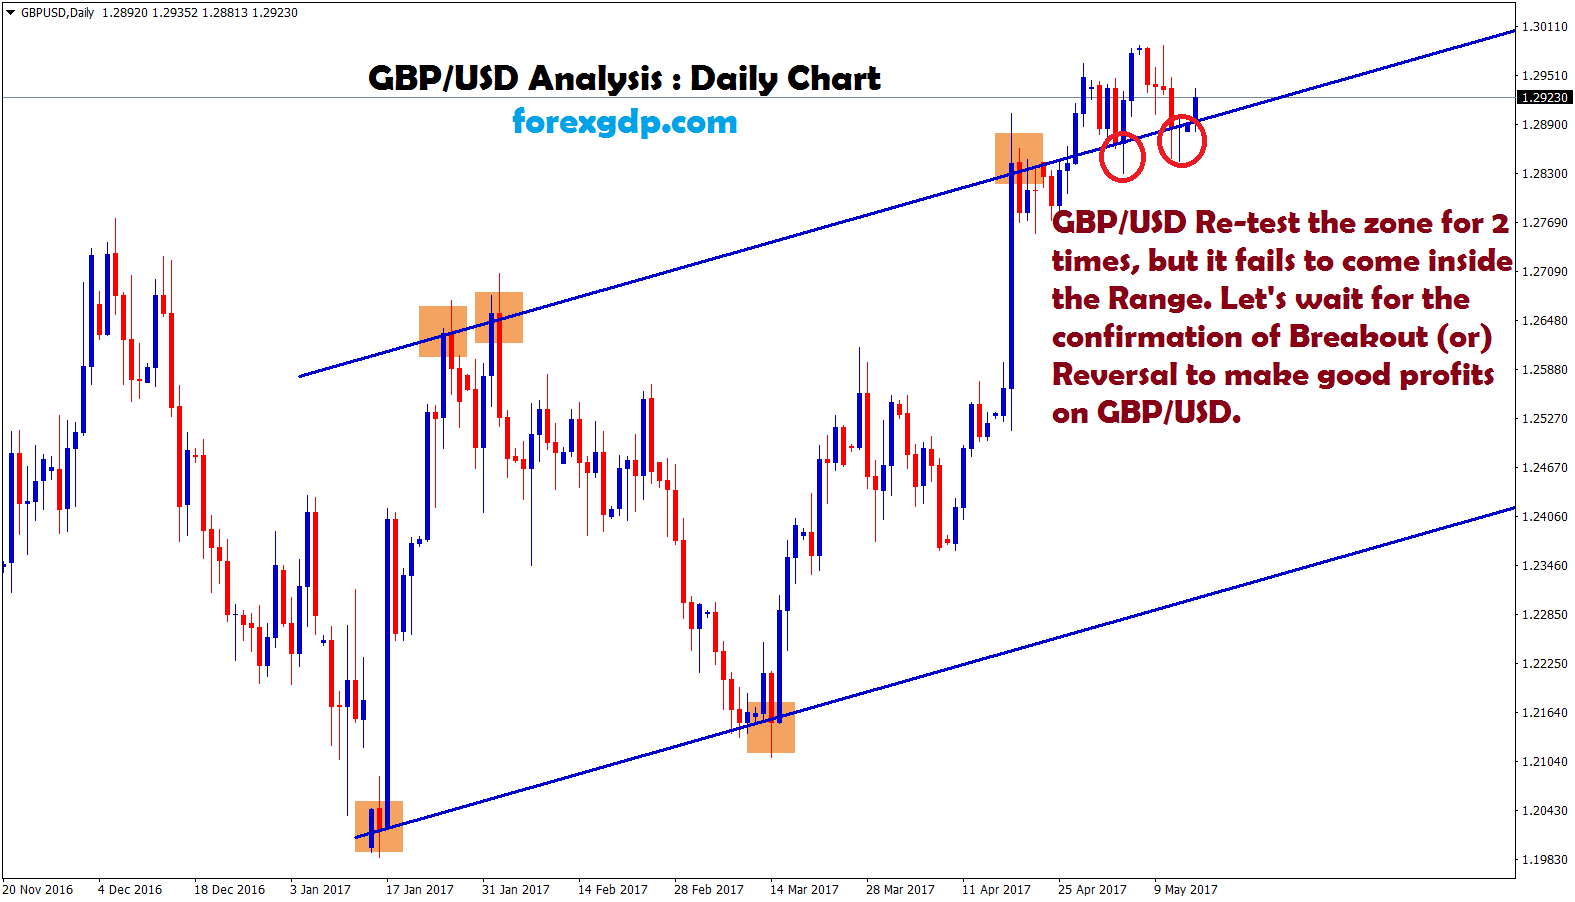
GBP/USD Analysis : After the announcement of UK Election date June 8, 2017, GBP/USD has made a straight upward move to…
-
EUR/GBP reaches the major support level 0.83 Good to buy now ?
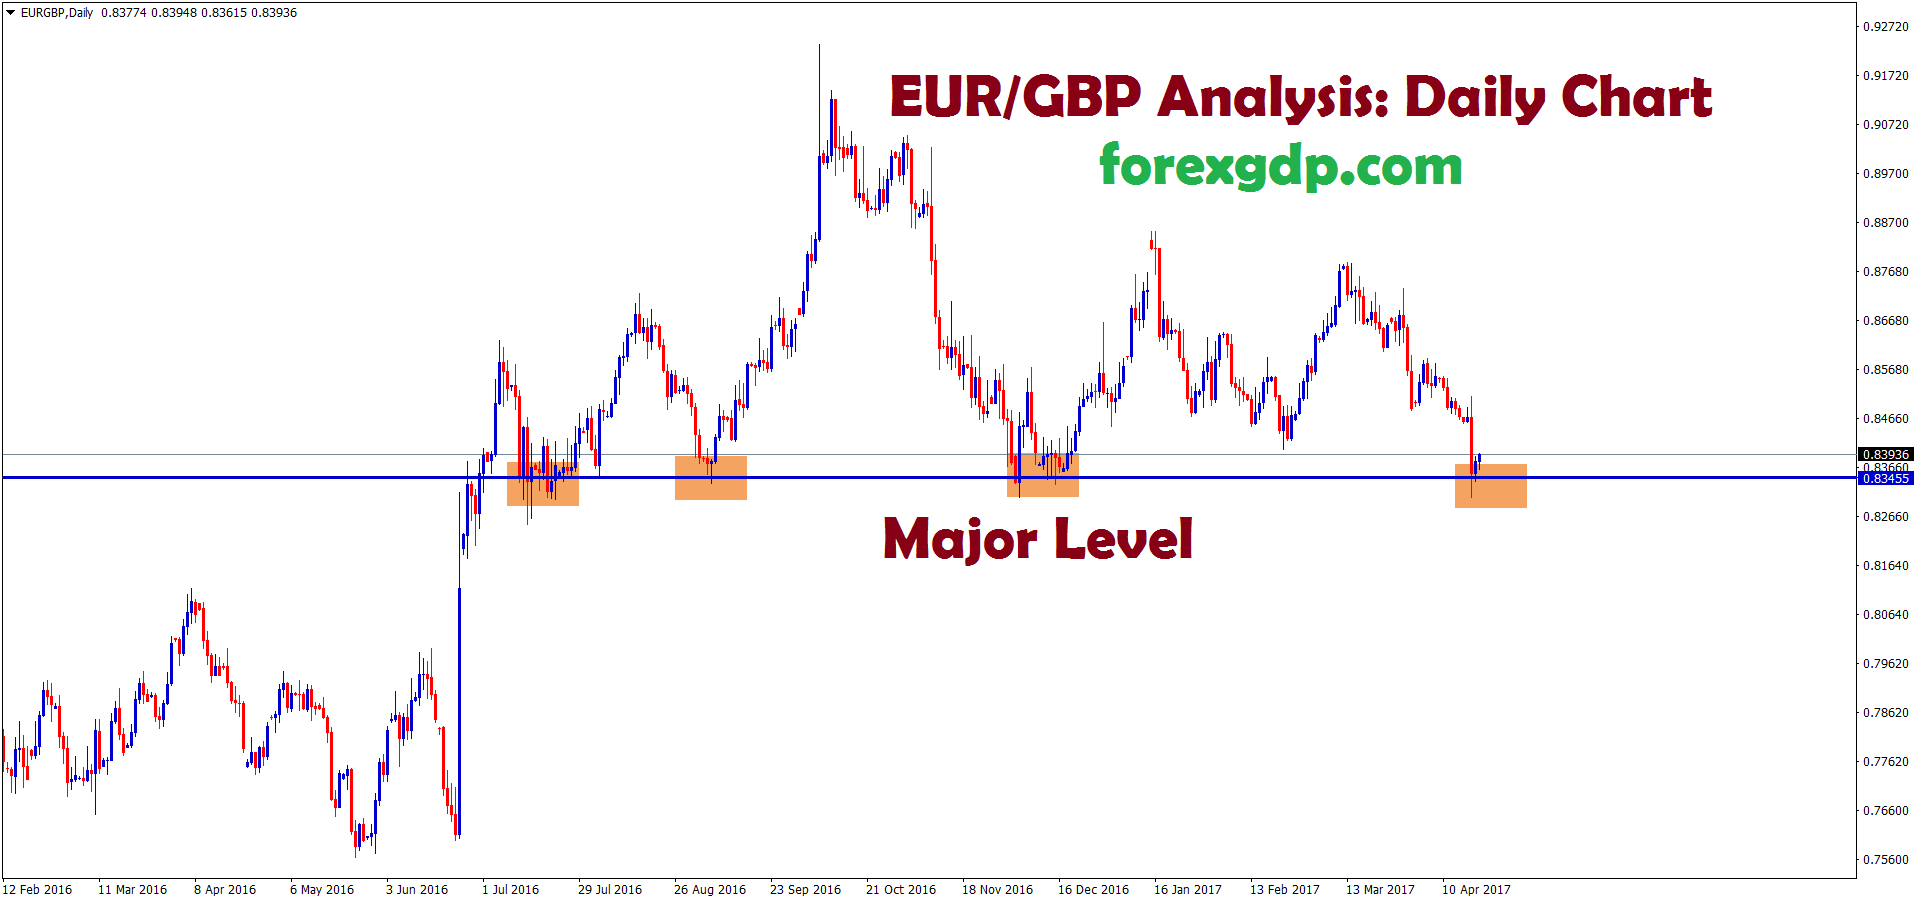
EUR/GBP Analysis : Daily Chart EUR/GBP reaches the major support level 0.83 for 4th time. U.K. Prime Minister "Theresa May" called for…
-
NZD/USD Fails again to Breakout the bottom zone
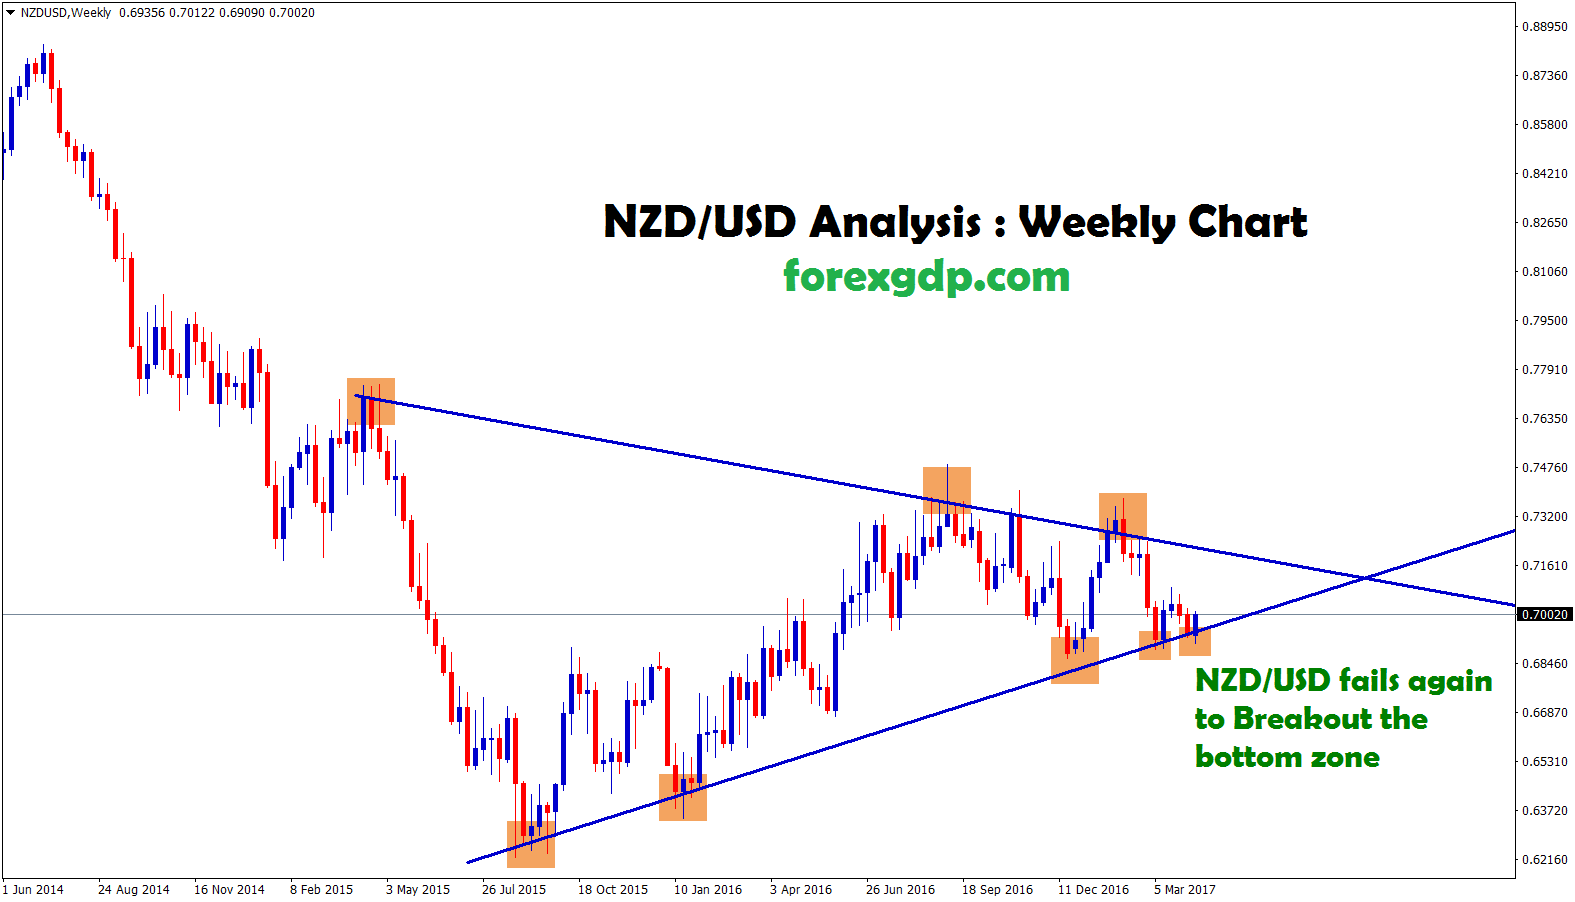
NZD/USD Analysis : NZD/USD still respecting the range area and keep moving up from the bottom zone. However, the market…
-
+2120 Points Profit Reached Successfully in AUD/CAD Sell Signal
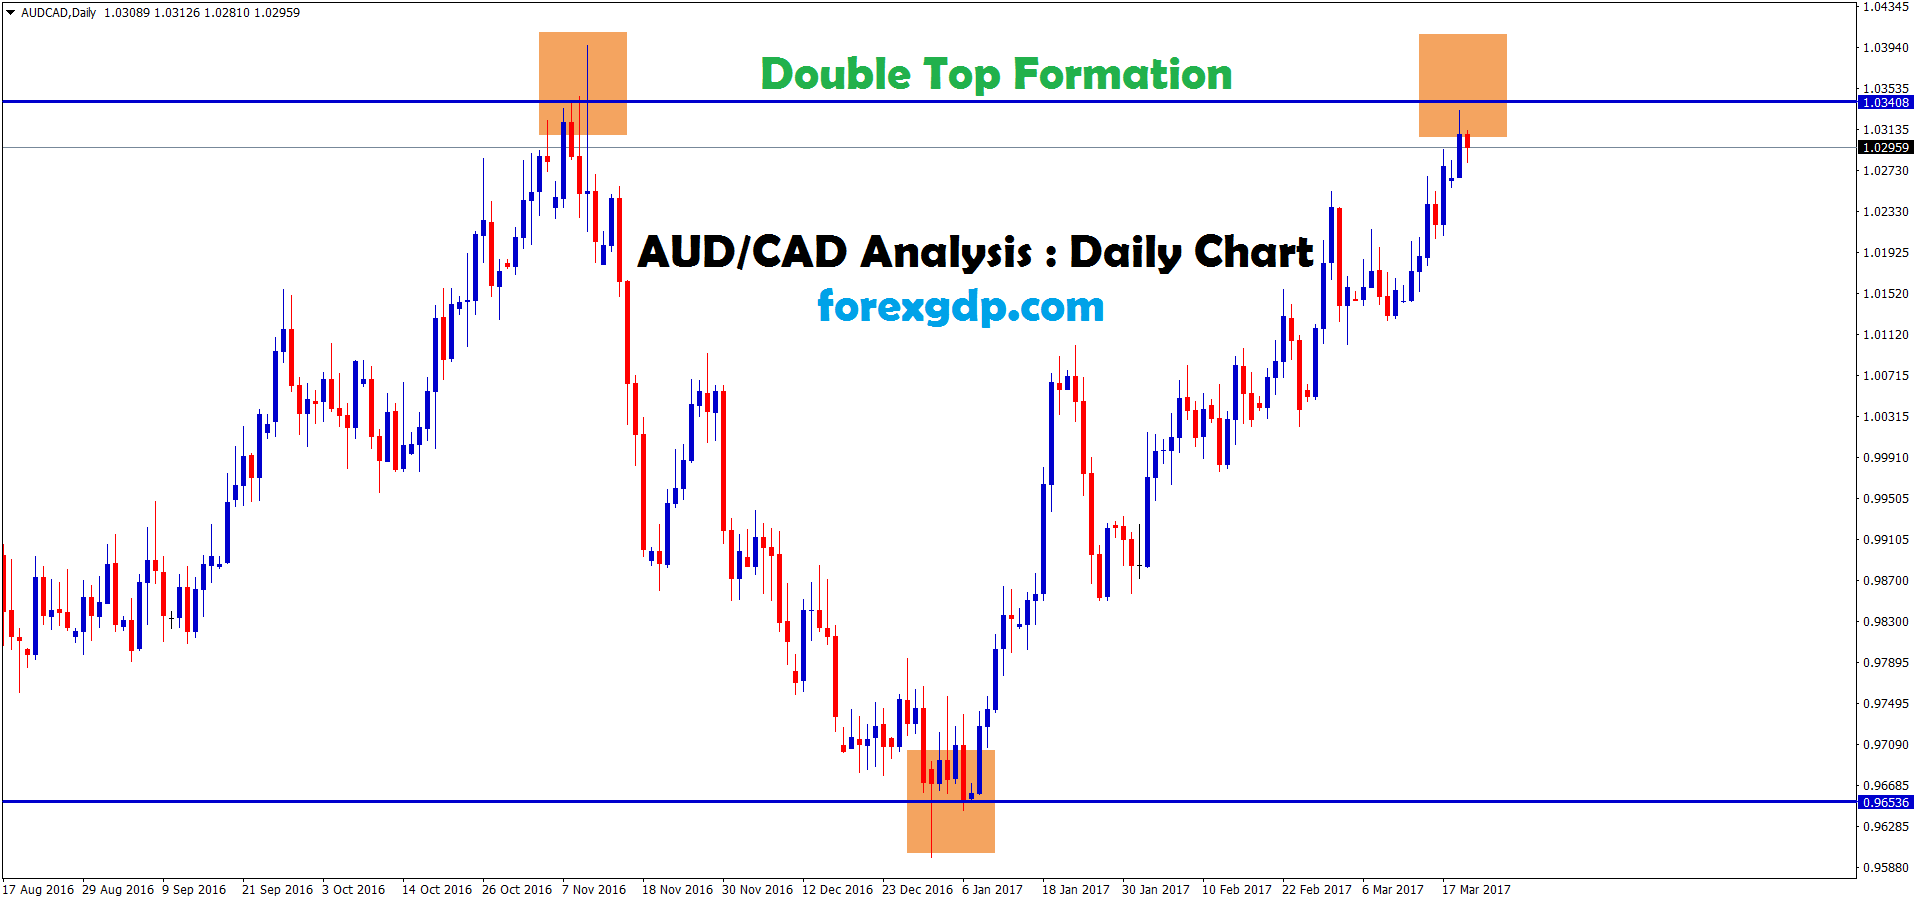
Reason for Selling AUD/CAD : As per our Previous Analysis, AUD/CAD Double Top Formation on Daily Chart confirms the reversal and…
-
EUR/USD trying to Breakout the Bottom. Is it good to Sell the Breakout ?
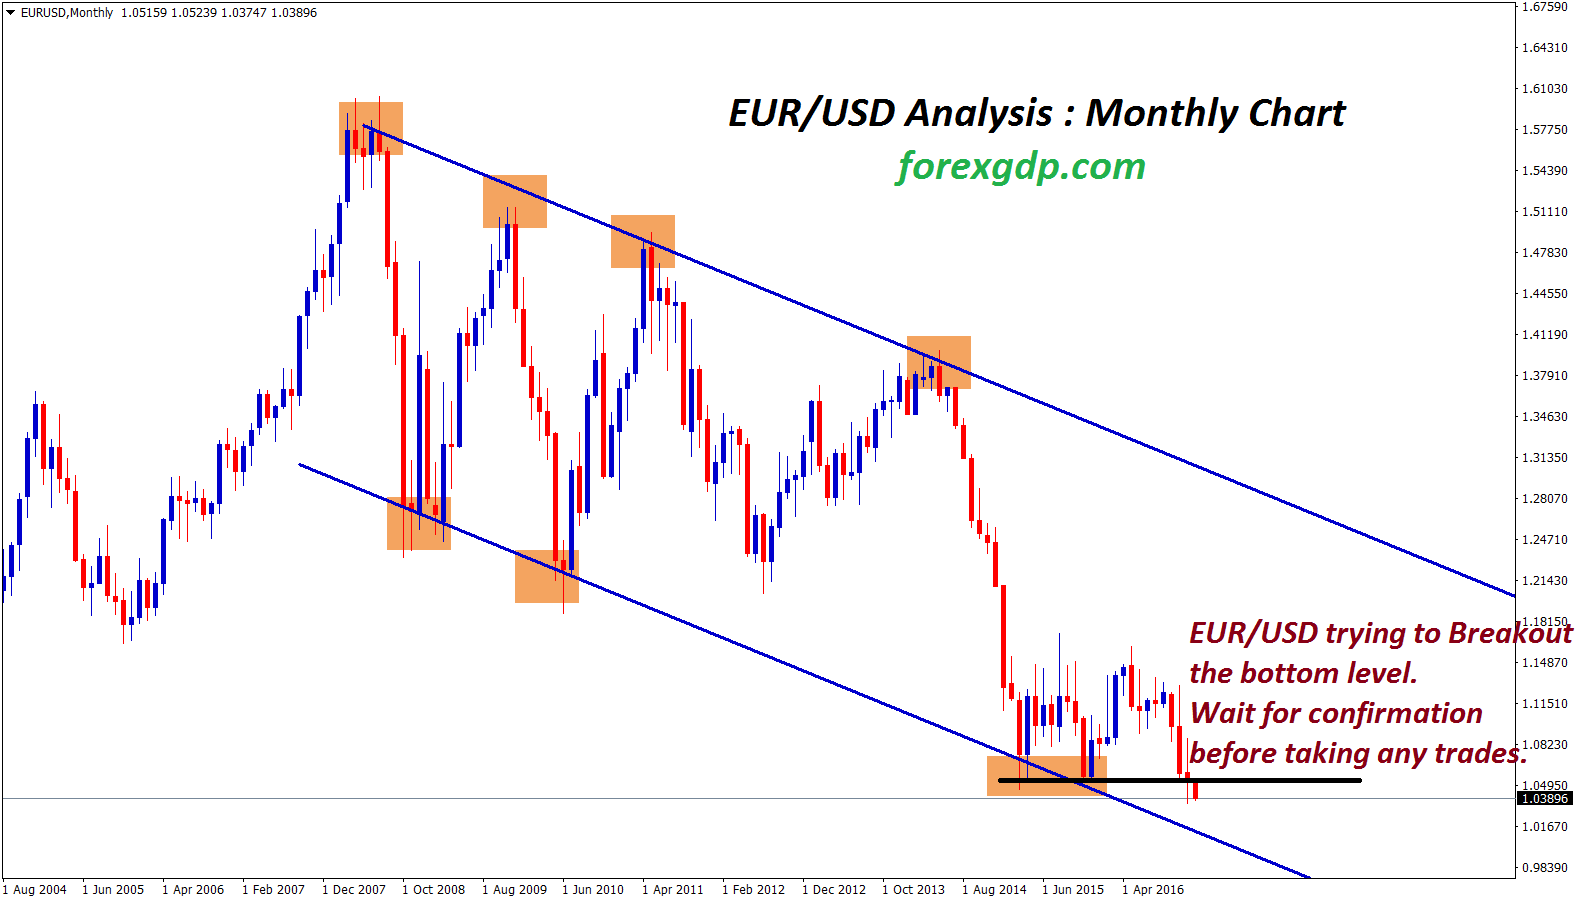
EUR/USD Analysis : After a Big straight downward movement from 1.40 price, the EUR/USD reaches the support zone 1.05 The 1.05…
-
NZD/USD Bouncing up from the Low Level. Good to Buy ?
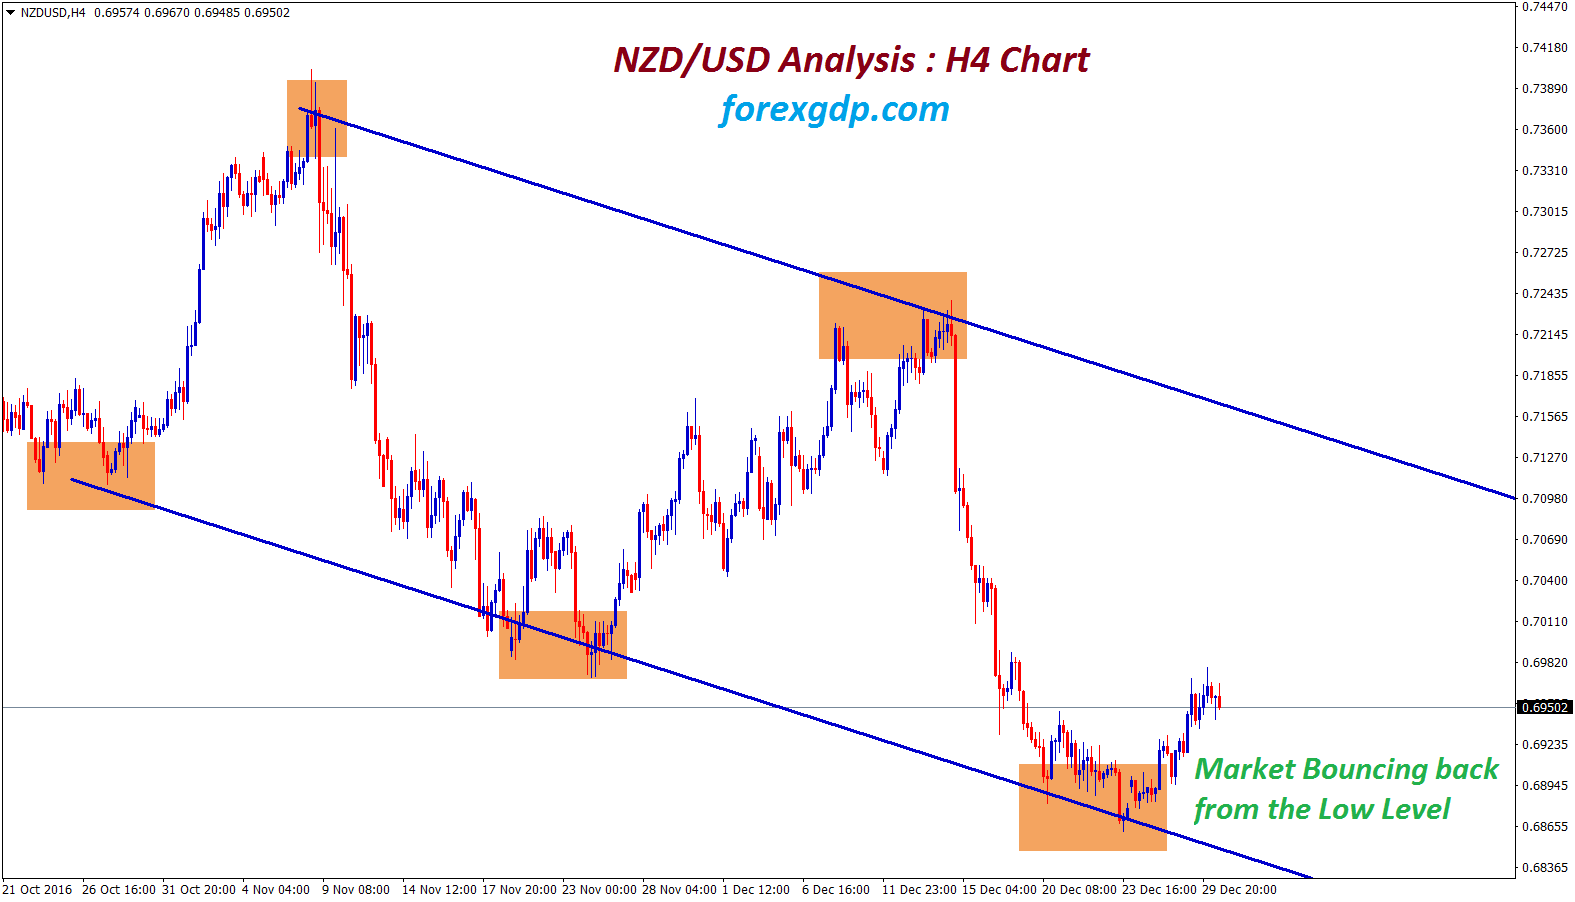
NZD/USD Analysis : Market hits the low level and bouncing up now. NZD/USD trying to make Retracements in a downtrend.…
- « Previous
- 1
- 2