How to Build a Simple Trading Plan That Actually Works
Every successful trader has a plan. Every struggling trader thinks they have one. The difference between the two is not complexity or sophistication — it is structure, consistency, and a willingness to address the unglamorous details that most beginners skip over.

A trading plan is not a list of indicators you like or a vague intention to “buy low and sell high.” It is a written document that defines exactly how you trade, when you trade, what you risk, and how you evaluate your performance. Without one, you are essentially gambling with a chart open.
This guide walks through the core components of a functional trading plan and how to put them together without overcomplicating the process.
Start With Your Trading Style
Before anything else, determine how you want to trade. This decision affects everything that follows — from the timeframes you use to the amount of screen time required.
Day traders open and close positions within a single session, requiring several hours of focused attention each day. Swing traders hold positions for days or weeks, checking charts once or twice daily. Position traders operate on weekly and monthly timeframes, making decisions based on macroeconomic trends.
There is no correct answer. The right style depends on your schedule, personality, and risk tolerance. A full-time employee with limited screen time will struggle as a day trader but may thrive as a swing trader. Be honest about your circumstances before choosing.
Define Your Market Analysis Method
Once your trading style is set, you need a method for reading the market and identifying trade setups. Most traders fall into one of two camps: technical analysis or fundamental analysis. Many use a combination of both.
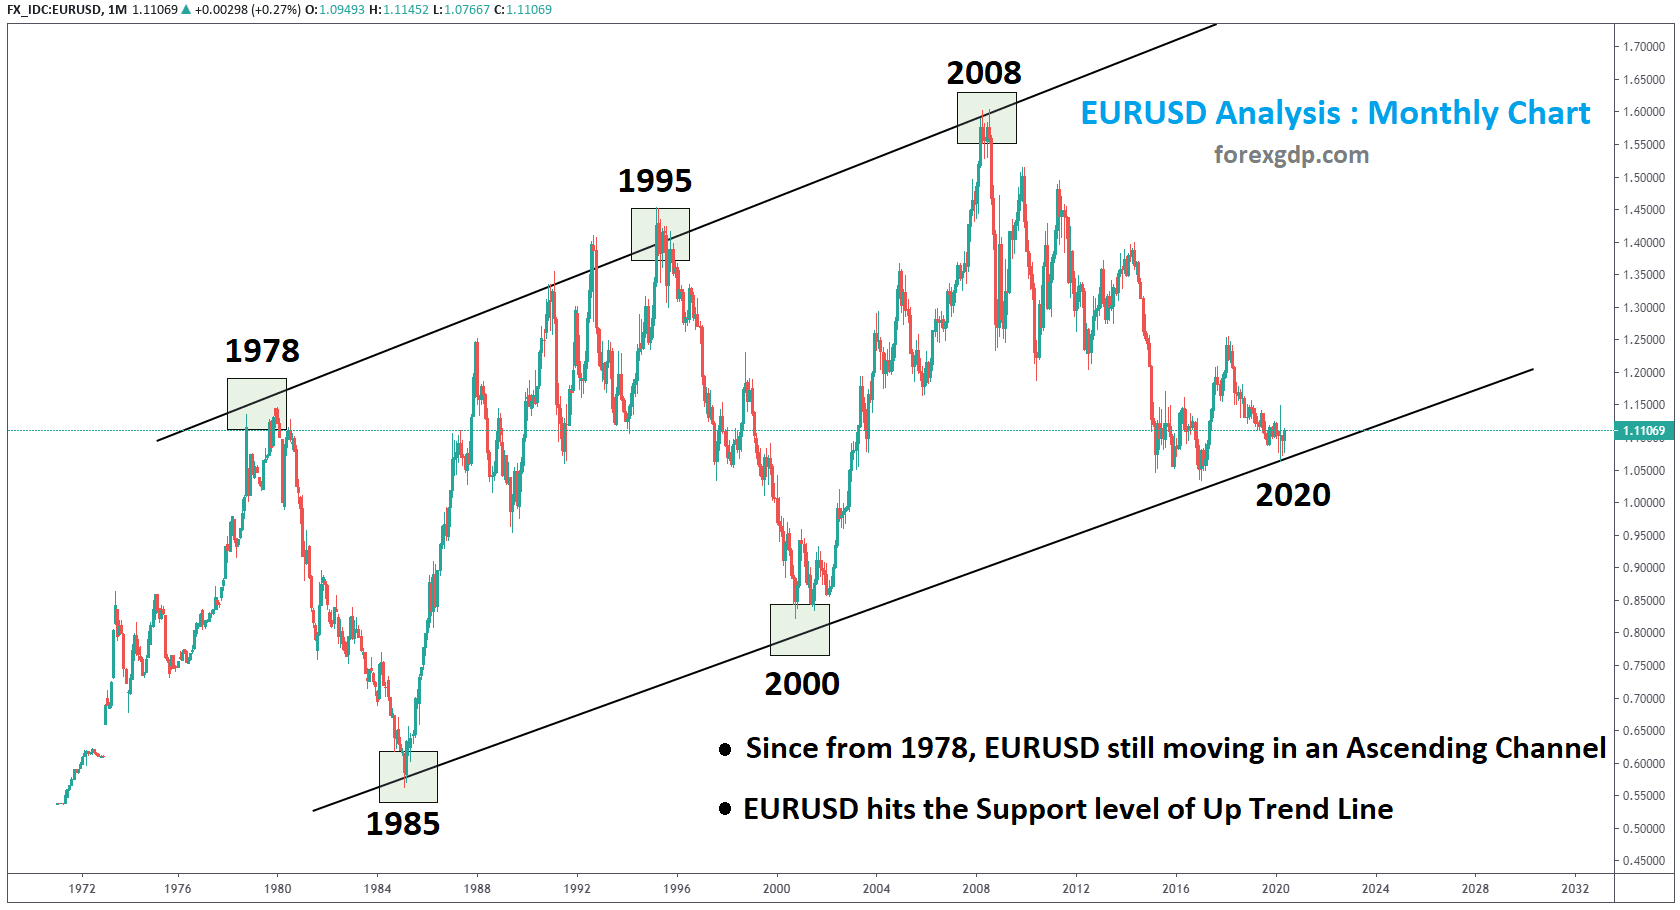
Technical traders rely on chart patterns and mathematical calculations to forecast price direction. Understanding how technical indicators work — from moving averages to RSI, MACD, and Bollinger Bands — gives you a toolkit for measuring momentum, trend strength, and potential reversal zones. Indicators are not crystal balls, but when used correctly, they provide objective data points that remove some of the guesswork from trading decisions.
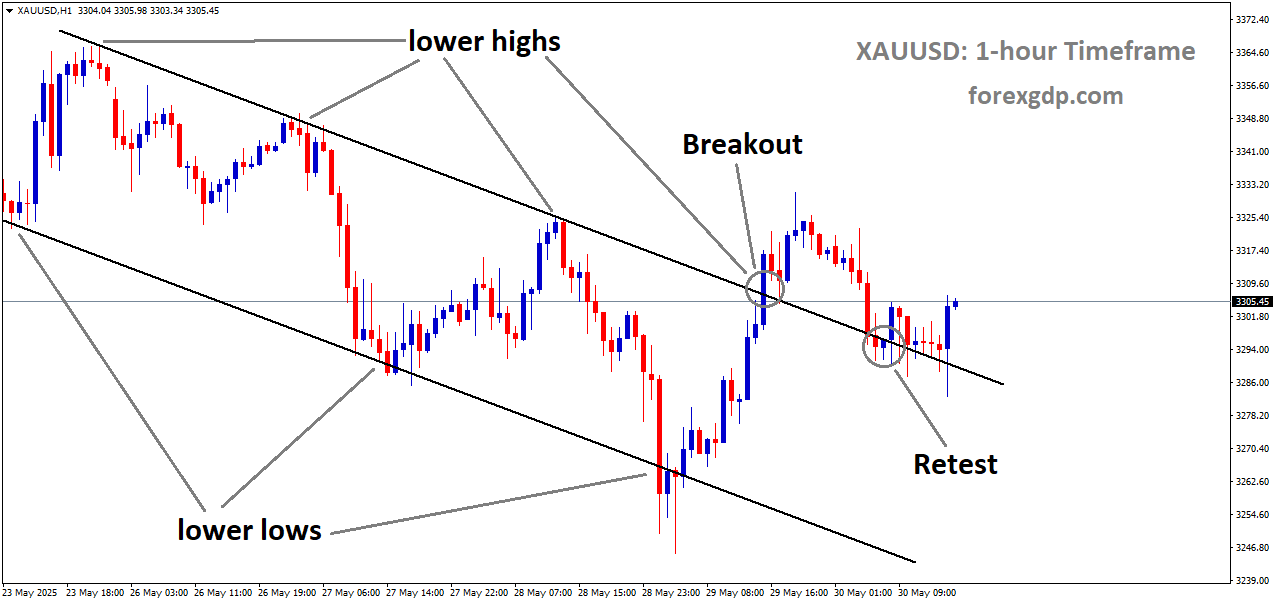
However, indicators alone do not tell the full story. The strongest setups occur when indicator signals align with what price itself is doing. This is where price action analysis becomes essential. Reading candlestick patterns, identifying support and resistance levels, understanding market structure, and recognizing breakout versus fakeout scenarios are skills that form the foundation of most professional trading approaches.
The combination of indicator-based signals and price action confirmation is what separates a trigger-happy beginner from a patient, selective trader. Your plan should specify exactly which tools you use and under what conditions they generate a valid trade signal.
Set Clear Entry and Exit Rules
A common mistake among beginners is defining entries but leaving exits to gut feeling. Your plan must include both.
Entry rules should be specific and repeatable. Instead of “buy when the trend looks bullish,” define it precisely: “Enter long when price closes above the 50 EMA, RSI is above 50, and a bullish engulfing candle forms at a support level on the 4-hour chart.” The more specific your rules, the easier it is to follow them consistently and evaluate their effectiveness over time.

Exit rules are equally important and often more difficult to define. You need rules for three scenarios: when the trade goes in your favour (take profit), when it goes against you (stop loss), and when it does neither (time-based exit). Many traders focus exclusively on entries and neglect their exits, which is like planning a road trip without knowing where you want to end up.
Stop loss placement should be based on market structure — below a recent swing low for long trades, above a recent swing high for shorts — not on an arbitrary number of pips. A stop loss that is too tight will get triggered by normal market noise. One that is too wide defeats the purpose of risk management.
Account for the True Cost of Trading
New traders frequently underestimate how much trading actually costs. The obvious expenses are spreads and commissions, but there is more beneath the surface.
Understanding trading costs in detail is critical for building realistic expectations. Spreads widen during low-liquidity periods such as the Asian session or around major news events. Swap fees accumulate on positions held overnight, which particularly affects swing traders. Slippage during volatile markets means your actual fill price may differ from what you see on screen.
These costs may seem small on individual trades, but they compound over time. A scalper executing thirty trades per day pays far more in cumulative spreads than a swing trader placing three trades per week. If your strategy produces an average profit of ten pips per trade but your total costs are eight pips, your actual edge is only two pips — a razor-thin margin that leaves no room for error.
Your trading plan should include a realistic calculation of your expected costs per trade, factored into your profit targets and risk-reward calculations. Ignoring this step is one of the most common reasons strategies that look profitable in backtesting fail in live markets.
Position Sizing and Risk Rules
This is the section that keeps you in the game. Without proper risk management, a string of losing trades can wipe out months of progress in days.
The most widely accepted approach is to risk a fixed percentage of your account on each trade — typically between one and two percent. This means that if your account balance is $5,000 and you risk one percent per trade, your maximum loss on any single trade is $50. Your position size is then calculated based on this dollar risk amount divided by the distance to your stop loss.
This method ensures that losing streaks reduce your position size automatically, protecting your capital during drawdowns. It also means that as your account grows, your position size grows proportionally, allowing your profits to compound.
Your plan should state your risk percentage, maximum number of open positions, maximum daily loss limit, and maximum weekly loss limit. These are your circuit breakers — the rules that prevent a bad day from becoming a blown account.
Define Your Trading Schedule
Markets are open twenty-four hours a day, five days a week, but that does not mean you should be trading all day. In fact, overtrading is one of the most destructive habits a beginner can develop.
Your plan should define specific trading sessions and preparation routines. For example: “I analyse charts at 7:00 AM before the London session opens. I look for setups on my watchlist of six pairs. If no valid setup exists, I do not trade. My active trading window is 8:00 AM to 12:00 PM. I review my trades and update my journal at 1:00 PM.”
This structure prevents you from sitting in front of charts for hours, manufacturing trades that do not meet your criteria. Boredom is the enemy of disciplined trading, and a defined schedule is your defence against it.
Keep a Trading Journal
A trading plan is only useful if you track whether you are following it. A journal records every trade you take, the reason you entered, the outcome, and any notes about your emotional state or deviations from the plan.

Over time, your journal becomes your most valuable tool. It reveals patterns you cannot see in real time — perhaps you consistently lose money on Friday afternoons, or your win rate drops significantly when you take more than three trades per day. These insights allow you to refine your plan based on actual data rather than assumptions.
The format does not matter. A spreadsheet, a notebook, or a dedicated app — whatever you will actually use consistently. The key is to record every trade, including the ones you would rather forget.
Test Before You Risk
No trading plan should go live with real money before it has been validated. Paper trading or demo accounts allow you to execute your plan in real market conditions without financial risk. This phase serves two purposes: it tests whether your rules produce a statistical edge, and it builds the habit of following your plan consistently.
Aim for at least fifty to one hundred trades on demo before going live. This gives you a meaningful sample size to evaluate win rate, average risk-reward ratio, maximum drawdown, and overall profitability. If the numbers do not work on demo, they will not work with real money.
Keep It Simple
The most effective trading plans are not the most complex. They are the ones that are clear enough to follow under pressure and simple enough to execute consistently. If your plan requires checking twelve indicators across four timeframes before placing a trade, you will either miss opportunities or cut corners under time pressure.
Start with a basic framework: one or two indicators, price action confirmation, clear entry and exit rules, defined risk parameters, and a journaling habit. Master that before adding complexity. The traders who succeed long term are not the ones with the most sophisticated systems — they are the ones who follow their system every single day.
This article is for educational purposes only and does not constitute financial advice. Trading forex involves significant risk, and past performance is not indicative of future results.