USDCAD Downtrend Analysis
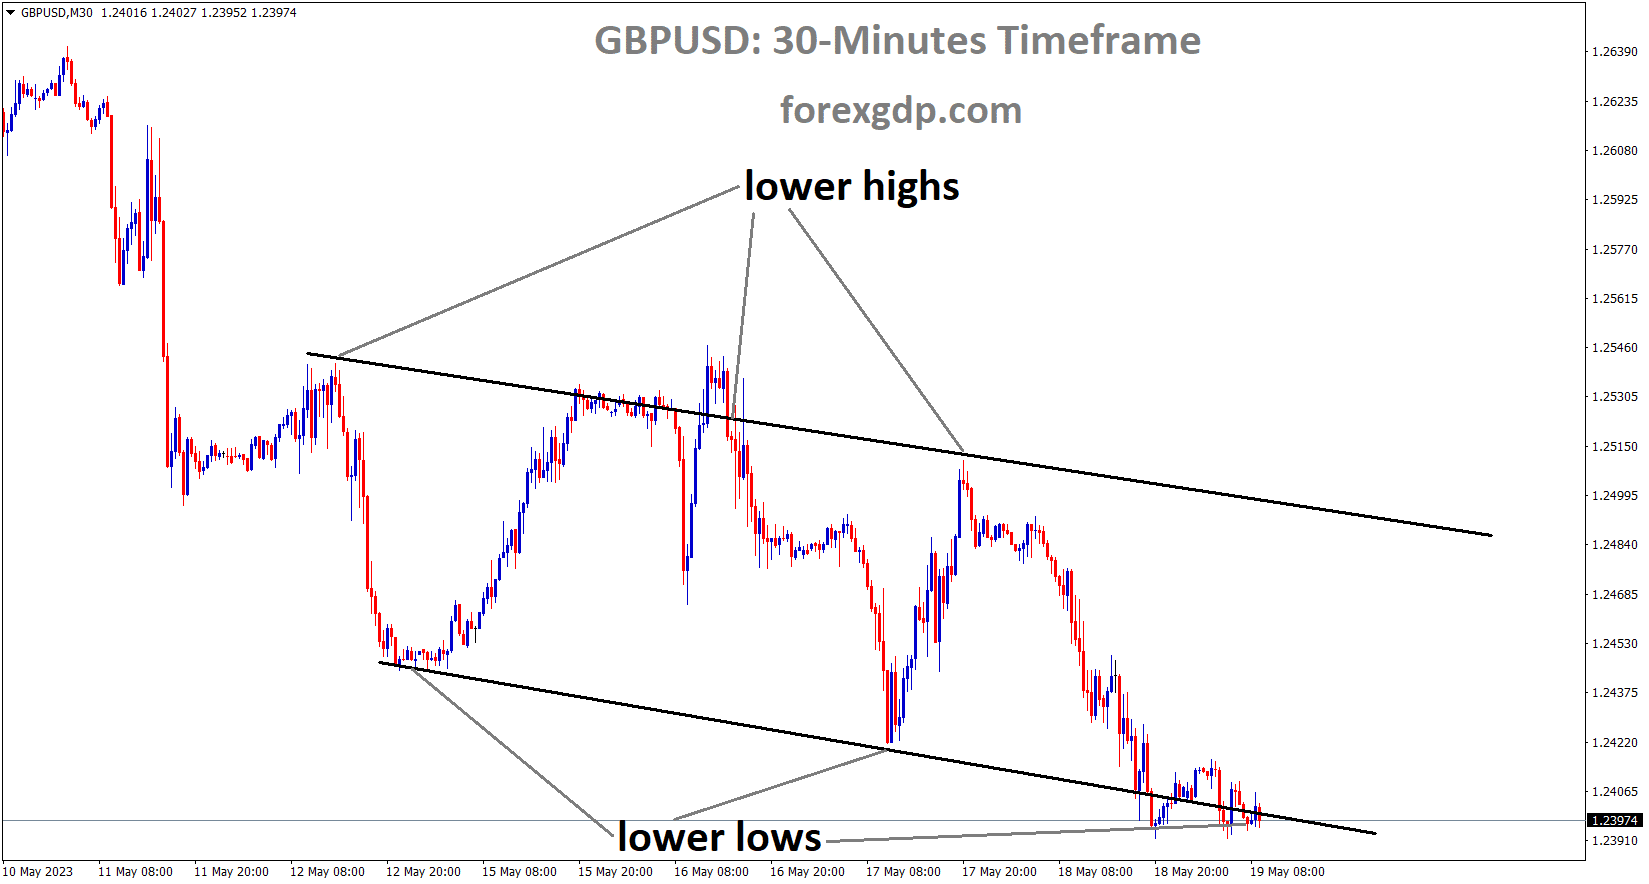
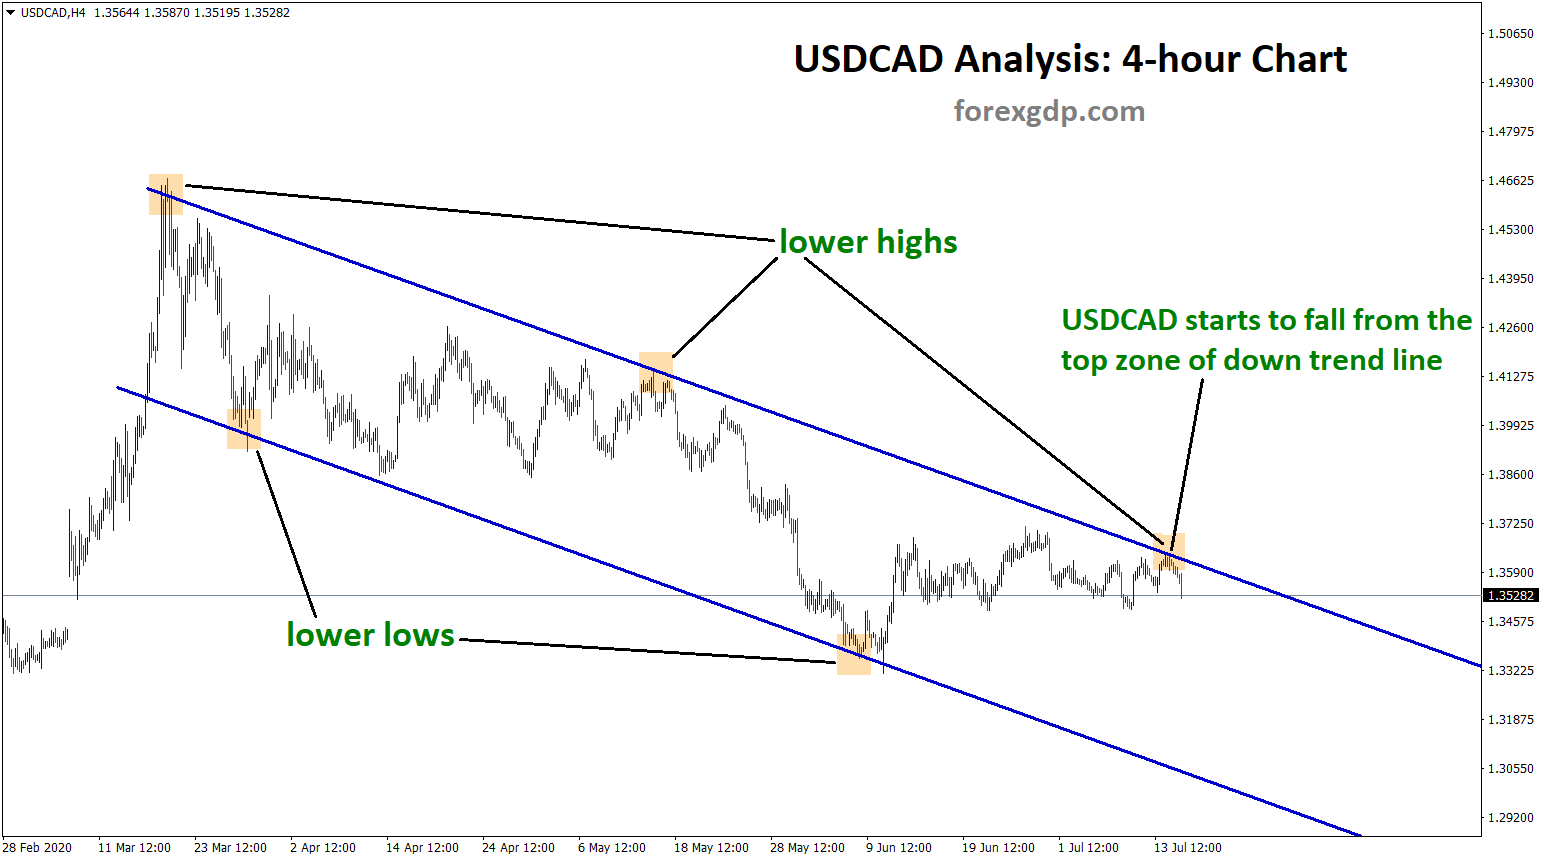
USDCAD is moving in a downtrend line for a long time by forming lower highs, lower lows in 4-hour timeframe chart.
Today Bank of Canada monetary policy report came positive, the recent economy added 953k jobs in June, 290k created in May month both months are a large increase in employment.
Around 1.25million new jobs need to be compensated against 3 million jobs lost in March and April.

USDCAD has broken the bottom of the Ascending Triangle Pattern and retested the breakout level 3 times.
But, it fails to move up because the downtrend line is stronger.
Series of rate cuts and lending rate down to 0.25% keep support for the economy, additional quantitative measures are taken by the government for economic recovery, anyhow US dollar weakness will boost up Canadian dollar to an extent.
As per technical view, USDCAD starts to fall now from the 3rd top zone of the down trend line.
Save your time on analyzing the market and take your trades only at good opportunities available in the market.
If you want to receive forex trading signals at best trade setup with chart analysis, subscribe now to our forex signals.