The year 2023 has proven to be pivotal for the United States’ economy and monetary policy. This comprehensive analysis delves into various facets of the U.S. economic landscape, examining the Federal Reserve’s recent decisions and their implications for the nation’s economic future. We will explore a wide range of topics, from GDP growth to inflation concerns, labor market dynamics, and global market reactions.
1: Federal Reserve’s Hawkish Hold on Interest Rates
1.1 The Fed’s Unanimous Decision

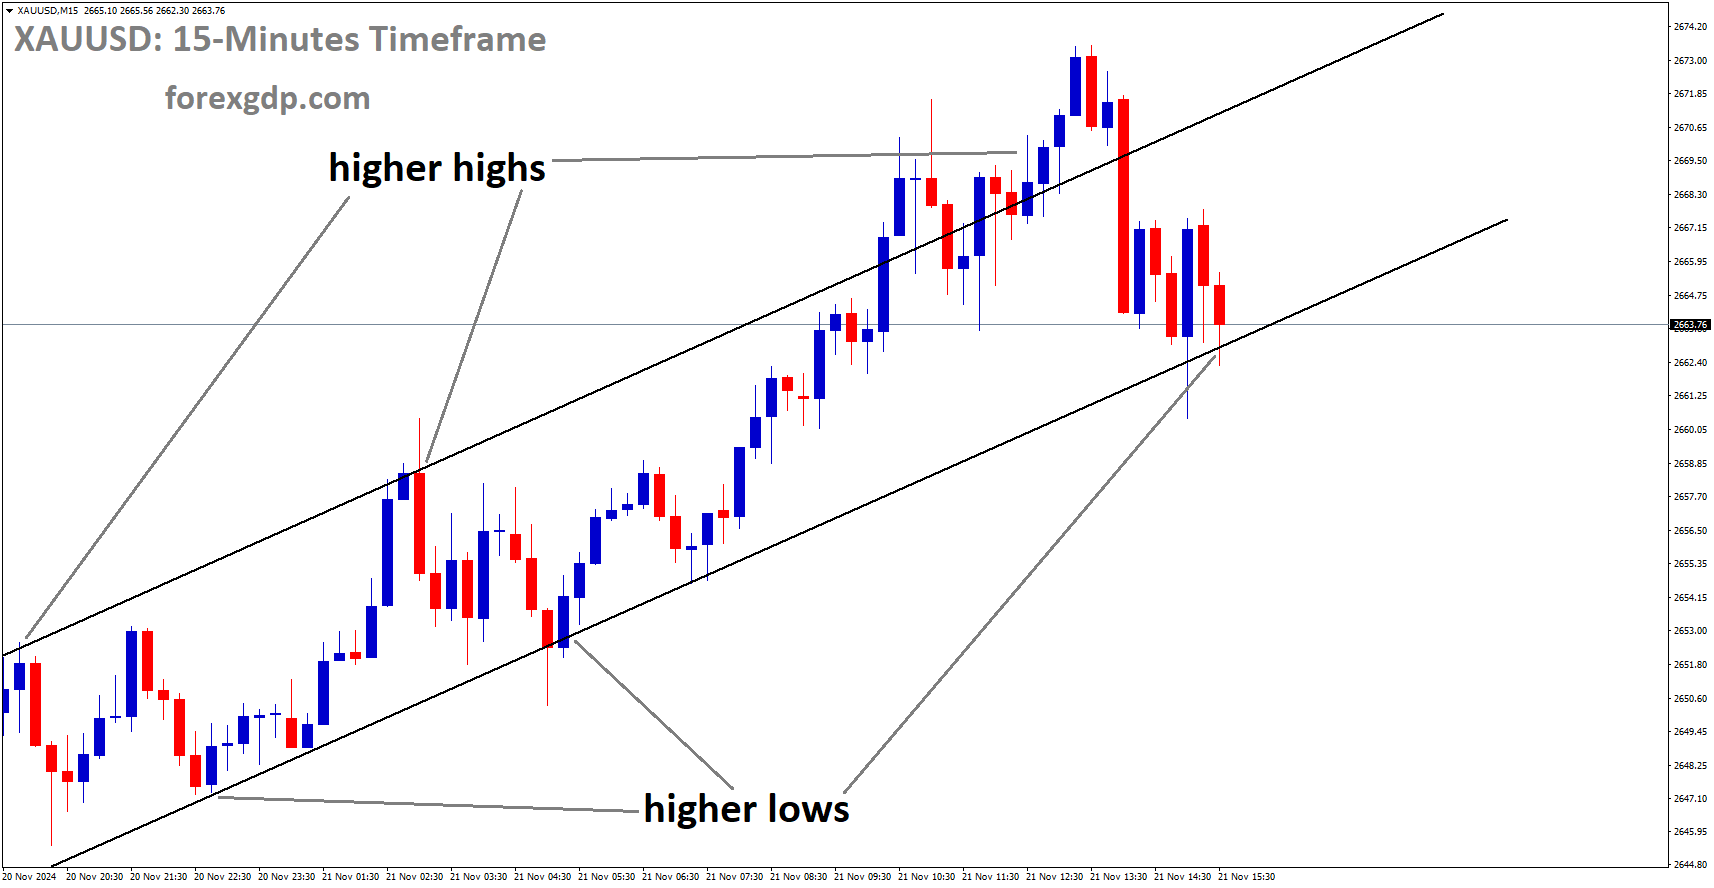
USDJPY is moving in an Ascending channel and the market has reached the higher high area of the channel
The Federal Reserve’s September 2023 policy meeting left no room for ambiguity. The central bank, in a unanimous decision, opted to maintain the target range for the funds rate at 5.25-5.50%. This stance solidified the Fed’s commitment to the tightening policy initiated in March 2022, which had seen a cumulative rate increase of 525 basis points.
The Fed’s steadfast decision reflected its confidence in the economic outlook, signaling a belief that the U.S. economy was on a sustainable growth path. However, it also underscored the Fed’s vigilance in managing the delicate balance between fostering growth and addressing inflationary pressures.
1.2 The Data-Dependent Fed
Fed Chair Jerome Powell’s statements at the meeting emphasized the central bank’s data-dependent approach to monetary policy. Powell emphasized that future policy decisions would be heavily influenced by incoming economic data, marking a departure from the rigid schedule of rate hikes seen in previous cycles.

This data-centric approach allows the Fed to maintain flexibility in responding to changing economic conditions, ensuring that policy adjustments are calibrated to the evolving needs of the U.S. economy. Powell’s message was clear: the Fed is closely monitoring economic indicators and stands ready to act as necessary.
1.3 Projections and Expectations
One of the focal points of the meeting was the release of the Fed’s dot-plot projections, which offered insights into the central bank’s expectations for future interest rates. Notably, the median projection of Federal Open Market Committee (FOMC) members pointed to rates remaining in a range of 5.50-5.75% at the end of 2023. This implied the likelihood of one more rate hike before the year concluded.
Even more pertinently, the Fed raised its dot-plot projections for 2024 and 2025 by 50 basis points, indicating an increasingly hawkish stance. The median projection showed that the FOMC now expects rates to be lowered to 5.1% by Q4 2024 and 3.9% at Q4 2025. This marked a significant shift from the previous dot-plot projections in June, which had foreseen rates at 4.6% by the end of 2024 and 3.4% at the close of 2025.
1.4 Market Reactions

USDCAD is moving in the Descending triangle pattern and the market has fallen from the lower high area of the pattern
The Fed’s hawkish hold had immediate repercussions in financial markets. Interest rate futures contracts reflected an increased likelihood of a rate hike in the closing quarter of 2023, with the probability rising from 40% to 60%. Treasury yields experienced a notable uptick, with two and ten-year yields reaching 16-17-year highs of 5.2% and 4.45%, respectively.
Equity markets faced headwinds, with stock prices declining in response to the perceived tightening of monetary policy. The U.S. dollar strengthened, resulting in the euro falling from $1.07 to $1.065. These market reactions underlined the consensus view that the Fed’s decision was indeed a hawkish one, increasing the likelihood of further rate hikes in 2023.
2: U.S. Economic Performance in 2023

2.1 Strong GDP Growth
The performance of the U.S. economy in 2023 has been a source of optimism. After expanding by 2.0% (annualized) in Q1, GDP grew by an even stronger 2.1% in Q2. This robust growth is indicative of an economy that has demonstrated resilience and a capacity to navigate various challenges.
The strength of GDP growth reflects the underlying fundamentals of the U.S. economy, including robust consumer spending, business investment, and government support. These factors have collectively contributed to the nation’s economic resilience in the face of global uncertainties.
2.2 Consumer and Investment Contributions
A closer look at the components of GDP growth in Q2 reveals the significant contributions made by various sectors. Consumption, a key driver of economic activity, rose by 1.7% in the quarter, albeit at a slower pace compared to the 4.2% growth seen in Q1. This still added 1.1 percentage points to GDP.

EURUSD is moving in the Descending channel and the market has reached the lower low area of the channel
Fixed investment, another critical element of economic growth, added 0.7 percentage points to the total. The government’s spending efforts further boosted growth by contributing 0.6 percentage points. However, the net trade and changes in inventories exerted a slight drag on GDP, subtracting 0.2 percentage points from the overall figure.
These contributions underscore the diversity of factors fueling economic growth, with both consumer and business spending playing pivotal roles in the recovery.
2.3 Q3 Momentum
Data available for Q3 suggest that the U.S. economy has maintained its momentum. Retail sales registered growth for five consecutive months, with notable month-on-month increases of 0.5% and 0.6% in July and August, respectively. The control group measure, a core retail sales indicator, also posted gains of 0.7% and 0.1% in the past two months.
Industrial production, which had experienced declines in May and June, rebounded strongly in Q3. Output expanded by 0.7% in July and by 0.4% in August, resulting in a 0.3% YoY increase. This recovery in industrial production suggests that the manufacturing sector, despite facing challenges, remains resilient.
3: Inflation Dynamics

3.1 Disinflationary Trends
Inflation dynamics have been a key focus in 2023. Despite earlier concerns about soaring inflation, the U.S. experienced a noticeable disinflationary trend. The headline Consumer Price Index (CPI) inflation rate jumped to 3.7% in August, up from 3.2% in July, but this remained well below the peak of 9.1% registered in June 2022.
Core inflation, which excludes volatile food and energy prices, exhibited a similar downward trajectory. It remained within a range of 5.5-5.7% in early 2023 before gradually declining to 4.3% in August.

GBPUSD is moving in the Descending channel and the market has reached the lower low area of the channel
This moderation in core inflation suggests that the sharp price increases witnessed earlier in the year were not indicative of sustained upward pressure on prices.
3.2 Fed’s Inflation Target
The Federal Reserve maintains a vigilant stance on inflation, with a steadfast commitment to its 2% inflation target. The central bank expects core Personal Consumption Expenditures (PCE) inflation, its preferred inflation measure, to move gradually towards this target over the next three years, reaching 2% by Q4 2026.
This measured approach to achieving the inflation target is indicative of the Fed’s cautious stance, as it seeks to balance the need for price stability with its mandate to support full employment and sustainable economic growth.
4: Labor Market and Earnings

4.1 Tight Labor Market
The state of the labor market in 2023 is marked by a delicate balance between tightness and slight softening. Payroll growth remained robust during the first half of the year, averaging 257,000 jobs per month. However, this pace slowed to 157,000 in July and 187,000 in August.
Despite the slowdown, the number of job openings remained elevated at 8.8 million in July, although it had decreased from the 11.2 million recorded at the end of 2022.

AUDUSD is moving in the Box pattern and the market has reached the support area of the pattern
Additionally, the unemployment rate, while still low, rose to 3.8% in August, marking its highest level since February 2022.
4.2 Earnings Growth
Average earnings growth, a critical indicator of labor market health, continued to be elevated at 4.3% YoY in August. While this rate is down from the peak of 5.9% seen in March 2022, it remains above pre-pandemic levels.
The persistence of elevated earnings growth suggests that the labor market continues to provide support to workers, even as the pace of job creation has moderated. The balance between strong earnings and a slightly softer labor market is emblematic of the ongoing adjustments in the employment landscape.
5: Global Economic Outlook

5.1 Euro Area Resilience
Beyond the borders of the United States, the Euro area has also been a point of interest. Despite facing its own set of challenges, the Euro area posted better-than-expected real GDP growth in Q2 2023.

NZDUSD is moving in an Ascending channel and the market has reached the higher low area of the channel
This resilience reflects the region’s ability to navigate headwinds and maintain economic stability.
5.2 Emerging Markets Opportunity
Emerging market sovereign debt, particularly high-yield issues, has garnered attention as an attractive opportunity in 2023. Progress on external financing agreements and policy adjustments toward economic orthodoxy have positioned emerging markets favorably.
The appeal of emerging markets lies in their potential for higher returns, albeit with associated risks. Investors are carefully weighing the opportunities presented by these markets in the context of the global economic landscape.
6: Currency Market Dynamics

6.1 Dollar’s Steady Performance
The currency market played a crucial role in reflecting market sentiment following the Fed’s decision to maintain interest rates. The U.S. dollar’s performance against its major currency pairs remained steady or showed slight advances.
Market participants viewed the Fed’s hint of another rate hike by year-end as an unexpected turn of events, prompting adjustments in currency positions. The dollar’s resilience in the face of changing monetary policy dynamics highlights its status as a global benchmark currency.
Conclusion
In conclusion, the year 2023 has been a period of dynamic developments in the U.S. economy and monetary policy. Robust GDP growth, a measured approach to inflation, and a labor market undergoing adjustments have characterized the economic landscape. The Federal Reserve’s hawkish stance, coupled with its data-driven decision-making, has implications for financial markets and investors.
The global economic outlook, with a focus on the Euro area and emerging markets, also shapes the narrative of 2023. As the year progresses, the interplay of economic forces, central bank policy, and market dynamics will continue to influence the trajectory of the U.S. economy. Adaptability and informed decision-making will be essential for investors and policymakers alike as they navigate the complexities of the economic landscape.
Don’t trade all the time, trade forex only at the confirmed trade setups.
Get more confirmed trade setups here: forexgdp.com/buy/