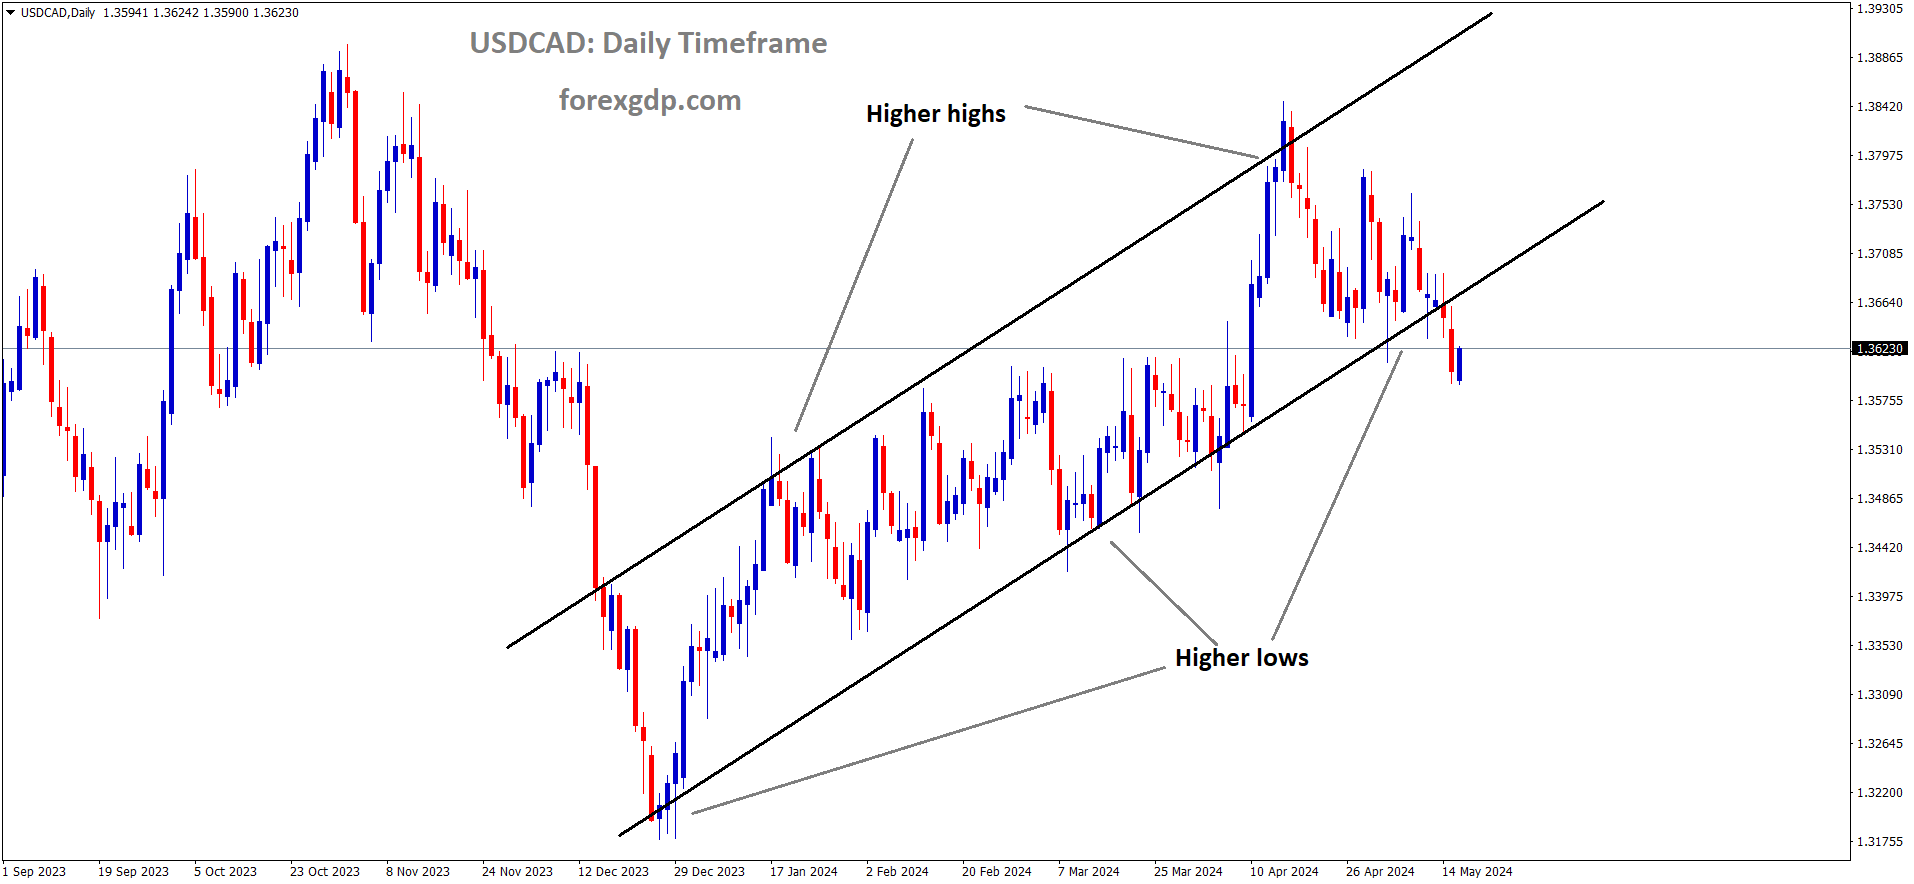
USDCAD is moving in an Ascending channel and the market has reached the higher low area of the channel
USDCAD – Bounces Over 1.3600, Attention on US Figures
The Canadian Manufacturing data for the month of March came at -2.1% declines when compared to 0.90% rise in the February month. But Rising Oil prices cap the downside of Canadian Dollar in the market.
The USD/CAD pair is witnessing a moderate recovery, hovering around 1.3615 in early European trading on Thursday. The slight uptick in the US Dollar (USD) is providing some buoyancy to the pair. Eyes are on a slew of US economic indicators scheduled later in the day, including Building Permits, Housing Starts, Initial Jobless Claims, Philly Fed Manufacturing Index, and Industrial Production.
Federal Reserve Bank of Minneapolis President Neel Kashkari emphasized on Wednesday the importance of closely monitoring the economy to gauge if current policy rates are restrictive enough. Fed Chair Jerome Powell earlier hinted that US inflation might persist longer than anticipated, possibly necessitating a prolonged hold on higher rates to achieve the central bank’s 2% target. However, Wednesday’s softer US inflation data has sparked speculation that the Fed might resort to interest rate cuts this year, consequently bolstering the Greenback across the board.

In April, the US Consumer Price Index (CPI) edged up by 3.4% year-on-year, slightly down from the previous 3.5% rise. The core CPI, excluding volatile items like food and energy, also moderated to a 3.6% year-on-year increase from 3.8% in the previous reading. Both figures aligned with market expectations. Additionally, monthly headline and core CPI inflation softened to 0.3% month-on-month in April from 0.4% in March. Meanwhile, April’s US Retail Sales stagnated at 0% month-on-month, falling short of the projected 0.4% increase.
On the Canadian Dollar (CAD) front, Statistics Canada revealed that March’s Canadian Manufacturing Sales fared worse than anticipated, declining by 2.1% month-on-month following a 0.9% uptick in February. This discouraging outcome exerted downward pressure on the Loonie. However, the CAD’s downside might be limited by the recent surge in oil prices, given Canada’s status as the largest oil exporter to the United States.
XAUUSD – Gold Prices Rise on US CPI Inflation, Prompting Speculation of Fed Rate Cuts
The US CPI Data for the month of April came at 3.4% when compared to 3.5% printed in the March month, Core CPI printed at 3.6% YoY versus 3.8% in the March month. Retail sales data for the month of April came at 0.0% versus 0.60% printed in the last month. Gold prices are flying over in the market against the USD after the weak domestic data printed last day. September month rate cut is now Full-fledged to 75% of Polls makes selling pressure on USD.
 XAUUSD Gold price is moving in an Ascending channel and the market has reached the higher high area of the channel
The price of gold (XAU/USD) experienced an upward trend on Thursday, buoyed by a weakening US Dollar (USD). This movement followed the release of the latest Consumer Price Index (CPI) report, which indicated a slowdown in inflation in the United States during April. This development led market participants to speculate about potential interest rate cuts by the US Federal Reserve (Fed) later this year. Lower interest rates typically favor gold, as they reduce the cost of borrowing for investments in the precious metal.
Traders in the gold market are closely monitoring several key economic indicators scheduled for release on Thursday, including US Building Permits, Housing Starts, weekly Initial Jobless Claims, the Philly Fed Manufacturing Index, and Industrial Production. Additionally, speeches by Fed officials Barr, Harker, Mester, and Bostic are anticipated to provide further insights. However, any hawkish remarks from these officials could strengthen the US Dollar (USD) and limit the upside potential for gold in the short term.

The US Consumer Price Index (CPI) data for April showed a year-on-year increase of 3.4%, slightly lower than the 3.5% rise recorded in March, aligning with market expectations. On a monthly basis, the headline CPI inflation declined to 0.3% from 0.4% in March, falling below the consensus forecast of 0.4%. Meanwhile, core CPI inflation, which excludes volatile items such as food and energy, rose by 3.6% year-on-year in April, down from the previous reading of 3.8%. The monthly core CPI also moderated to 0.3% in April from 0.4% in March.
Furthermore, US Retail Sales data for April showed no change from the previous month, compared to a 0.6% increase in March, falling short of the estimated 0.4% growth.
In light of these developments, Neel Kashkari, President of the Federal Reserve Bank of Minneapolis, emphasized the need for the central bank to carefully monitor the economy to determine if current policy rates are sufficiently accommodative.
Financial markets have responded to these signals by adjusting expectations, with the likelihood of a Fed rate cut in September 2024 increasing to nearly 75%, up from 65% prior to the release of the US CPI report, according to the CME’s FedWatch Tool.
Meanwhile, the World Gold Council’s Q1 2024 report revealed that global gold demand saw a 3% increase to 1,238 tonnes, marking the strongest first quarter performance since 2016.
EURUSD – steadies around 1.0900 amid boosted risk appetite
The Euro zone Q1 GDP data came at 0.30% expansion makes the great come back from 0.10% contraction in the last 2 quarters of 2023. Annualised basis 0.30% came at with expected rate. The ECB and FED Policy divergence is closer view due to Higher data in the Euro zone and Lower data in the US Zone. The Euro moved higher against USD after the data printed.

EURUSD is moving in an Ascending channel and the market has reached the higher high area of the channel
The decline in the US Dollar (USD) is contributing to the pressure on the EUR/USD pair, a trend likely influenced by an improved risk appetite in the market.
Wednesday’s release of lower-than-expected monthly Consumer Price Index (CPI) and Retail Sales data in the United States (US) has bolstered the prospect of multiple rate cuts by the Federal Reserve (Fed) throughout 2024. US CPI slowed to 0.3% month-over-month in April, falling short of the expected 0.4% reading, while Retail Sales remained flat, below the anticipated 0.4% increase.
This decline is partly attributed to the weakening US Treasury yields, with the 2-year and 10-year yields standing at 4.71% and 4.32%, respectively.

On the Euro side, Wednesday’s release of the seasonally adjusted Gross Domestic Product (GDP) for the Eurozone revealed a 0.3% quarter-on-quarter expansion in the first quarter, meeting market expectations. This growth marks a recovery from the 0.1% contraction experienced in each of the previous two quarters. Additionally, the annual growth rate aligned with expectations at 0.4%.
The Euro is finding support from increasing expectations for a convergence in monetary policy between the Eurozone and the US. The European Central Bank (ECB) is anticipated to consider lowering rates during its upcoming meeting in June. Meanwhile, market expectations are rising for the Fed to initiate interest rate cuts starting from September, particularly after core inflation slowed in April for the first time in six months.
USDJPY – Japan’s Q1 GDP shrinks 0.5% QoQ vs. -0.4% forecast
The Japan Q1 GDP data came at -0.50% versus -0.40% expected and 0.10% expanded in the last quarter. The Annualized reading shows -2.0% versus -1.5% expected and 0.40% expanded last time. The Declining GDP Data forming positive for Japanese Yen due to rate hold at steady manner by BoJ.

USDJPY is moving in the Descending channel and the market has reached the lower high area of the channel
According to data released by the Cabinet Office on Thursday, the Gross Domestic Product (GDP) of Japan for the first quarter (Q1) experienced a quarter-on-quarter (QoQ) contraction of -0.5%, compared to the -0.4% that was expected. This contrasts with the previous quarter’s growth of 0.1%.

Additionally, the Annualized GDP for the same period showed a contraction of 2.0%, falling short of the expected 1.5% contraction and reversing the 0.4% expansion seen in the previous period.
USDCHF – Swiss franc loan decrease
The Central Bank of Cyprus reported Swiss Franc denominated loans have declined to Euro 99 Million and Euro Denominated loans to Euro 25.11 Billion. The case of 2015 more affected Swiss Franc Loan Borrowers heavily in Cyprus due to higher appreciation of Swiss Franc against Euro in 2015. At that time Court favors for Swiss Loan Borrowers and shift the loans to Euro format with same rate of interest and rejected the claims of Swiss bank 14% pre closure charges. Now Swiss Franc loans are more suppressed after the incident happened in the 2015.

USDCHF is moving in an Ascending channel and the market has reached the higher low area of the channel
As of March 2024, Swiss franc loans are experiencing a decline in utilization, as borrowers are actively managing their existing loans. Banks are either converting some of these loans into euros or selling them. This shift reflects a broader trend in the borrowing landscape, where the euro has now taken precedence. The total borrowing volume in euros stands at €25.11 billion, out of which €22.59 billion is denominated in euros.
In stark contrast, Swiss franc loans have dwindled significantly, amounting to a mere €99 million. This is a stark drop from the €2 billion recorded in 2005, which previously posed substantial challenges for borrowers and prompted discussions in the Parliamentary Committee on Economic Affairs.
The surge in Swiss franc loans in Cyprus started in 2006 and gained momentum in 2007 and 2008, as banks heavily promoted them due to their attractive low interest rates and favorable exchange rates against the euro. However, challenges emerged in 2015 when the Swiss franc appreciated against the euro, increasing repayment burdens for borrowers.

This phenomenon was not isolated to Cyprus but also affected Eastern European countries such as Hungary, Serbia, Poland, Romania, and Croatia.
In 2022, a judge at the Paphos district court ruled in favor of borrowers whose Swiss franc loans were granted by the National Bank of Greece (Cyprus) Ltd. These borrowers, represented by the Zambartas law firm, saw their loans converted into euros at the exchange rate applicable at the time the loan was granted. Additionally, the court ruled against the bank’s attempt to impose interest on late payments and rejected its claim to charge 14% interest on the loan closure amount.
This ruling echoes similar court decisions in favor of Swiss currency borrowers in Poland, Hungary, and Croatia.
The banking system in Cyprus also encompasses deposits in various currencies. As of March 2024, total deposits amounted to €52.23 billion, with €45.85 billion held in euros. Other deposits include €5.33 billion in US dollars, €32.2 million in Swiss francs, €9.4 million in Japanese yen, and €730.6 million in Sterling.
USD INDEX – USD Weakens Due to Disappointing CPI Data
US CPI Data for the month of April came at 3.4% versus 3.5% printed in the March month. Core CPI printed at 0.30% in a Monthly Basis. CPI Data lower than previous month makes FED rate cuts sooner than expected from analysts side. So US Dollar dropped down more against counter pairs today.

USD INDEX is moving in the Box pattern and the market has fallen from the resistance area of the pattern
The US Dollar Index (DXY) experienced significant losses, hovering around 104.4 on Wednesday, following the release of softer-than-anticipated Consumer Price Index (CPI) data and stagnant Retail Sales figures from April.
The US economy appears to be facing pressure as the inflation rate for April exhibited signs of deceleration. Federal Reserve (Fed) Chair Jerome Powell’s cautious approach, combined with mixed readings in the Producer Price Index (PPI), have underscored concerns regarding future inflationary trends, contributing to the downward pressure on the US Dollar.
According to reports from the US Bureau of Labor Statistics, the inflation rate decreased to 3.4% year-on-year (YoY) in April, down from 3.5% in the previous month, aligning with market forecasts. The annual core CPI also saw a decline to 3.6% in April from 3.8% YoY in March, consistent with expectations. Both CPI and core CPI registered a modest 0.3% month-on-month (MoM) increase during this period.

Furthermore, Retail Sales in the US showed no growth in April, falling short of the anticipated 0.4% MoM rise and indicating a slowdown from the 0.6% MoM reported in the preceding month. The stagnation in Retail Sales could signal potential challenges for the US economy, prompting the Fed to contemplate earlier-than-expected rate cuts.
According to the CME FedWatch tool, the likelihood of a hold in June is nearing certainty, while the odds of a rate cut in July have slightly increased. Among the upcoming Federal Open Market Committee (FOMC) meetings, September’s session is currently perceived to have the highest probability of witnessing a rate cut.
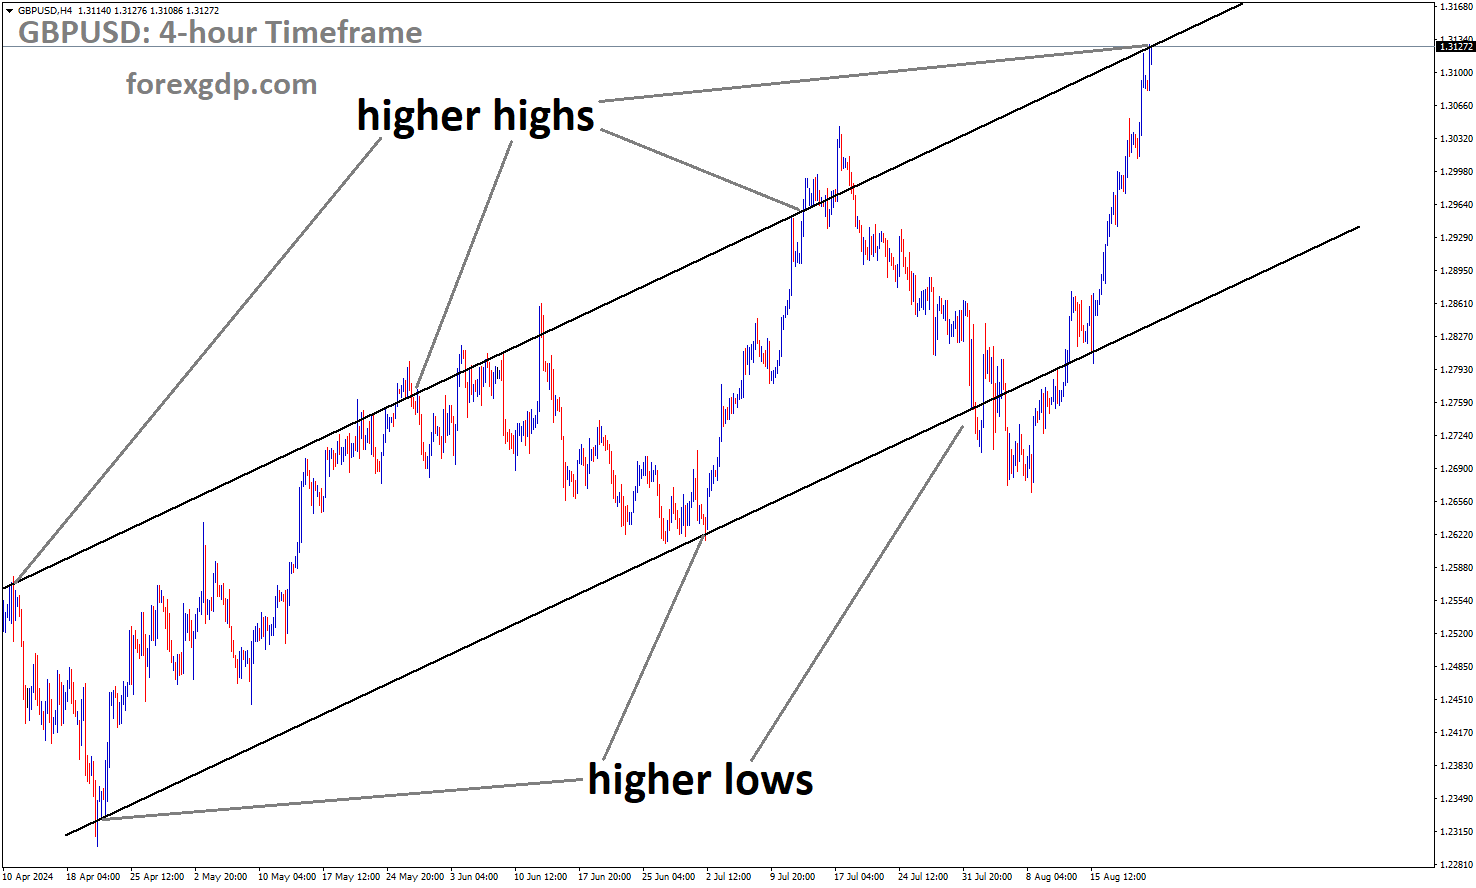
GBPUSD – climbs above 1.2680 as US Dollar weakens
The unemployment rate rose in the April month and unemployment people rose in the April month shows UK economy is downfall in the employment numbers, but inflation in the services area are higher so BoE is in Difficult situation whether to cut the rates or not. Many economist predicted rate hold at neutral stance until the inflation come to target of 2% in the UK.

GBPUSD is moving in an Ascending channel and the market has reached the higher high area of the channel
This climb is bolstered by the weakened US Dollar following the release of softer US CPI inflation data. Later in the day, investors will closely watch the release of key US economic indicators, including Building Permits, Housing Starts, Initial Jobless Claims, Philly Fed Manufacturing Index, and Industrial Production. Additionally, speeches from Federal Reserve officials Barr, Harker, Mester, and Bostic are scheduled for Thursday.
In the US, April’s inflation figures showed a slight easing, with the Consumer Price Index (CPI) rising 3.4% year-on-year, compared to 3.5% in March, according to the US Bureau of Labor Statistics (BLS). The core CPI, which excludes volatile items, also moderated to 3.6% year-on-year in April from 3.8% previously. Both figures aligned with expectations. Month-on-month, both the CPI and core CPI increased by 0.3% in April. The softer inflation data increased the likelihood of a Federal Reserve rate cut in 2024, weighing on the US Dollar and providing support for the GBP/USD pair.

Furthermore, April’s Retail Sales data showed no change from the previous month’s 0.6% increase, falling short of the anticipated 0.4% rise.
On the GBP front, UK employment data indicated a deterioration in job market conditions for the third consecutive month, with the Unemployment Rate rising. Despite this, Bank of England (BoE) policymakers remain concerned about high service inflation, which could hinder progress in the disinflation process. This has led to uncertainty regarding potential BoE interest rate cuts.
AUDUSD – AUD near key level, USD stays strong
The Australian Q1 Wage price index came at 0.80% versus 0.90% expected, Employment change came at 38.2K versus 23.7K expected and Unemployment rate rise to 4.1% in the April month versus 3.9% printed in the March month. China is planned to Rise 1 Trillion Yuan by issuing 20 and 50 Yr Bonds in the market. Local Governments in the China is planned to buy the Unsold homes in the China to recover the property losses in the Chinese economy. This is the Bold step taken by China for it Real estate boom from Bottom area by no investors ready to invest in the China property sector. So Australian Dollar Jumped up by this massive efforts taken by China Government on Real estate sector crisis.

AUDUSD is moving in an Ascending channel and the market has reached the higher high area of the channel
The Australian Dollar (AUD) saw a halt to its three-day winning streak following the release of mixed employment data on Thursday. Moreover, Australia’s 10-year government bond yield dipped to around 4.2% after the Wage Price Index (QoQ) for the first quarter showed a 0.8% increase, slightly below the expected rise of 0.9%. These figures have contributed to a dovish sentiment surrounding the Reserve Bank of Australia (RBA) regarding monetary policy, putting pressure on the AUD/USD pair.
Earlier on Thursday, the Australian Dollar received early support due to improved risk appetite following lower-than-expected monthly Consumer Price Index and Retail Sales data in the United States (US) released on Wednesday. This raised expectations of multiple rate cuts by the Federal Reserve (Fed) in 2024, weakening the US Dollar (USD). As a result, the AUD/USD pair reached a four-month high of 0.6714 on Thursday.

Meanwhile, the US Dollar Index (DXY), which measures the performance of the USD against six major currencies, retraced its daily losses thanks to improved US Treasury yields, lending support to the Greenback. By press time, the 2-year and 10-year yields on US Treasury bonds stood at 4.73% and 4.33%, respectively.
In other news, the Australian Bureau of Statistics released the seasonally adjusted Employment Change for April, revealing an increase of 38.5K to 14.3 million employed people in Australia. However, the Australian Unemployment Rate rose to 4.1% in April from the previous reading of 3.9%, marking the highest jobless rate since January.
Looking ahead, various factors such as speeches from Reserve Bank of Australia (RBA) officials and economic data releases, including US Building Permits, Housing Starts, Initial Jobless Claims, the Philly Fed Manufacturing Index, and Industrial Production, are likely to influence currency markets. Additionally, ongoing developments such as the Australian Budget for 2024-25, US Consumer Price Index (CPI), and Producer Price Index (PPI) will also play a role in shaping market sentiment.
NZDUSD – climbs past 0.6100, awaits US data
The US Domestic data came at lower than expected last day makes NZ Dollar moved higher against USD. The Westpac analysts predicted the RBNZ will hold the rates at next meeting is 5.25% this news makes comeback from lows for NZ Pairs against counter pairs.

NZDUSD has broken the Descending channel in the Upside
This uptick in the New Zealand Dollar (NZD) against the US Dollar (USD) is attributed to the softer-than-expected US Consumer Price Index (CPI) data for April, which has fueled expectations of potential rate cuts by the Federal Reserve (Fed) later this year. Market participants are now turning their attention to a series of US economic indicators scheduled for release later in the day, including housing data, the weekly Initial Jobless Claims, the Philly Fed Manufacturing Index, and Industrial Production.
In April, inflation in the United States showed signs of cooling, with the CPI rising by 3.4% year-over-year (YoY), slightly below March’s reading of 3.5%, in line with market expectations. The core CPI, which excludes volatile items like food and energy, also moderated from 3.8% in March to 3.6% in April, as anticipated. Additionally, US Retail Sales remained flat at 0% month-over-month (MoM) in April, falling short of the consensus forecast of 0.4%. These softer inflation figures and weaker-than-expected Retail Sales have led to a decline in the US Dollar (USD), pushing it to near five-week lows around 104.20.

Investors are speculating that the Fed will adopt a wait-and-see approach, awaiting more data to gauge whether inflation will return to the central bank’s target of 2%. Fed Chair Jerome Powell noted earlier in the week that inflation is decelerating at a slower pace than anticipated, and the Producer Price Index (PPI) data further supported the notion of maintaining higher interest rates for a longer period.
Regarding the New Zealand Dollar, market sentiment suggests that the Reserve Bank of New Zealand (RBNZ) is unlikely to cut interest rates before the Fed, which has bolstered the NZD and provided tailwinds for the NZD/USD pair. Analysts at Westpac anticipate that the RBNZ will maintain the Official Cash Rate (OCR) at 5.5% during its May meeting and will likely reiterate its forward guidance communicated in the February meeting.
CRUDE OIL – Oil Prices Experience Volatility on Wednesday, Rebounding Amid Increased Risk Appetite
The EIA Energy report revealed for May 10 ending this week, Reserves of US Oil fallen by -2.5 Million Barrels versus -1.3 Million Barrels expected decline and -1.3 Million Barrels fallen last week is noted. Oil reserves fallen on oneside and US economy data is falling on another side makes Double treat for Oil prices to ramp up in the market.

XTIUSD Oil price is moving in an Ascending channel and the market has reached the higher low area of the channel
West Texas Intermediate (WTI) US Crude Oil experienced a notable downturn on Wednesday, dropping to its lowest level in eight weeks, sinking below $76.40 before staging a recovery to reach $78.40. The decline was followed by a rebound in broad-market risk appetite, particularly during the US market session, driven by the release of the US Consumer Price Index (CPI) inflation data, which showed a decrease.
The April CPI inflation figures revealed a month-on-month decrease to 0.3%, compared to the expected steady rate of 0.4%. This unexpected decline fueled market expectations for potential Federal Reserve (Fed) rate cuts, leading to a surge in risk appetite across various markets and subsequently driving Crude Oil prices higher. The easing of inflationary pressures further intensified speculation about potential rate cuts by the Fed. According to the CME’s FedWatch Tool, there is now more than a 70% likelihood of a rate cut by the Fed in September.

Meanwhile, the Energy Information Administration (EIA) reported a faster-than-expected decline in Crude Oil Stocks Change for the week ending May 10. The EIA data showed a decrease of -2.508 million barrels, surpassing the forecasted decline of -1.35 million barrels and extending further from the previous week’s decline of -1.362 million barrels. This reduction in US Crude Oil reserves contributed to the strengthening of Crude Oil prices as market participants interpreted it as a sign of potential supply constraints, raising concerns about whether US Crude Oil production would be able to meet or exceed market demand.
Don’t trade all the time, trade forex only at the confirmed trade setups
Get more confirmed trade signals at premium or supreme – Click here to get more signals , 2200%, 800% growth in Real Live USD trading account of our users – click here to see , or If you want to get FREE Trial signals, You can Join FREE Signals Now!