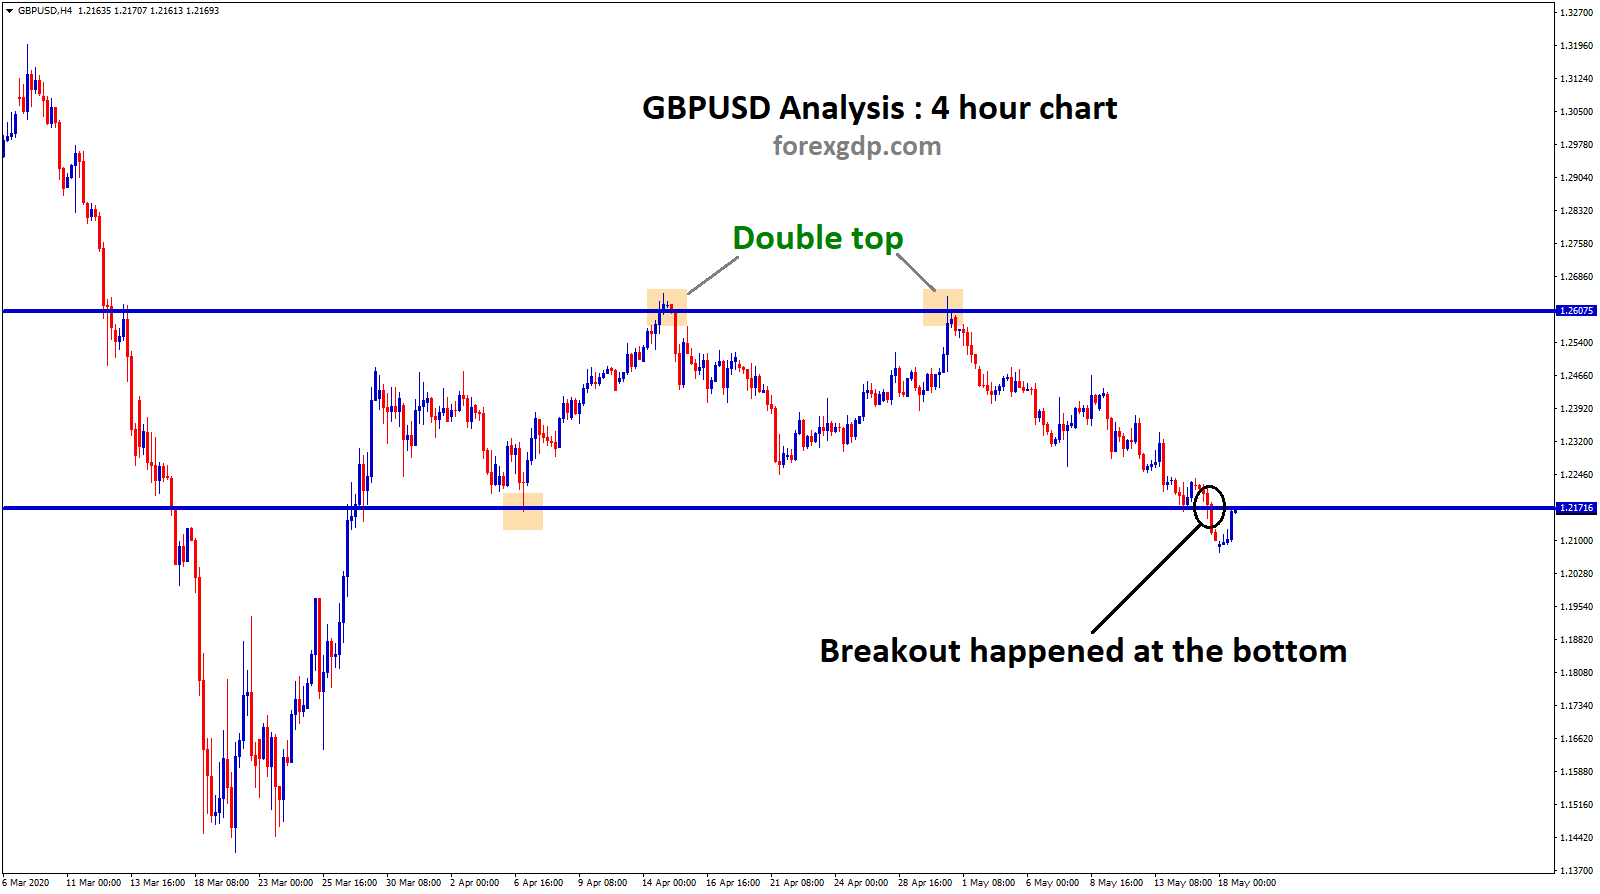
GBPUSD Double Top Chart Analysis
GBPUSD formed a double top in 4 hour chart.
Recently, market broken the bottom zone.
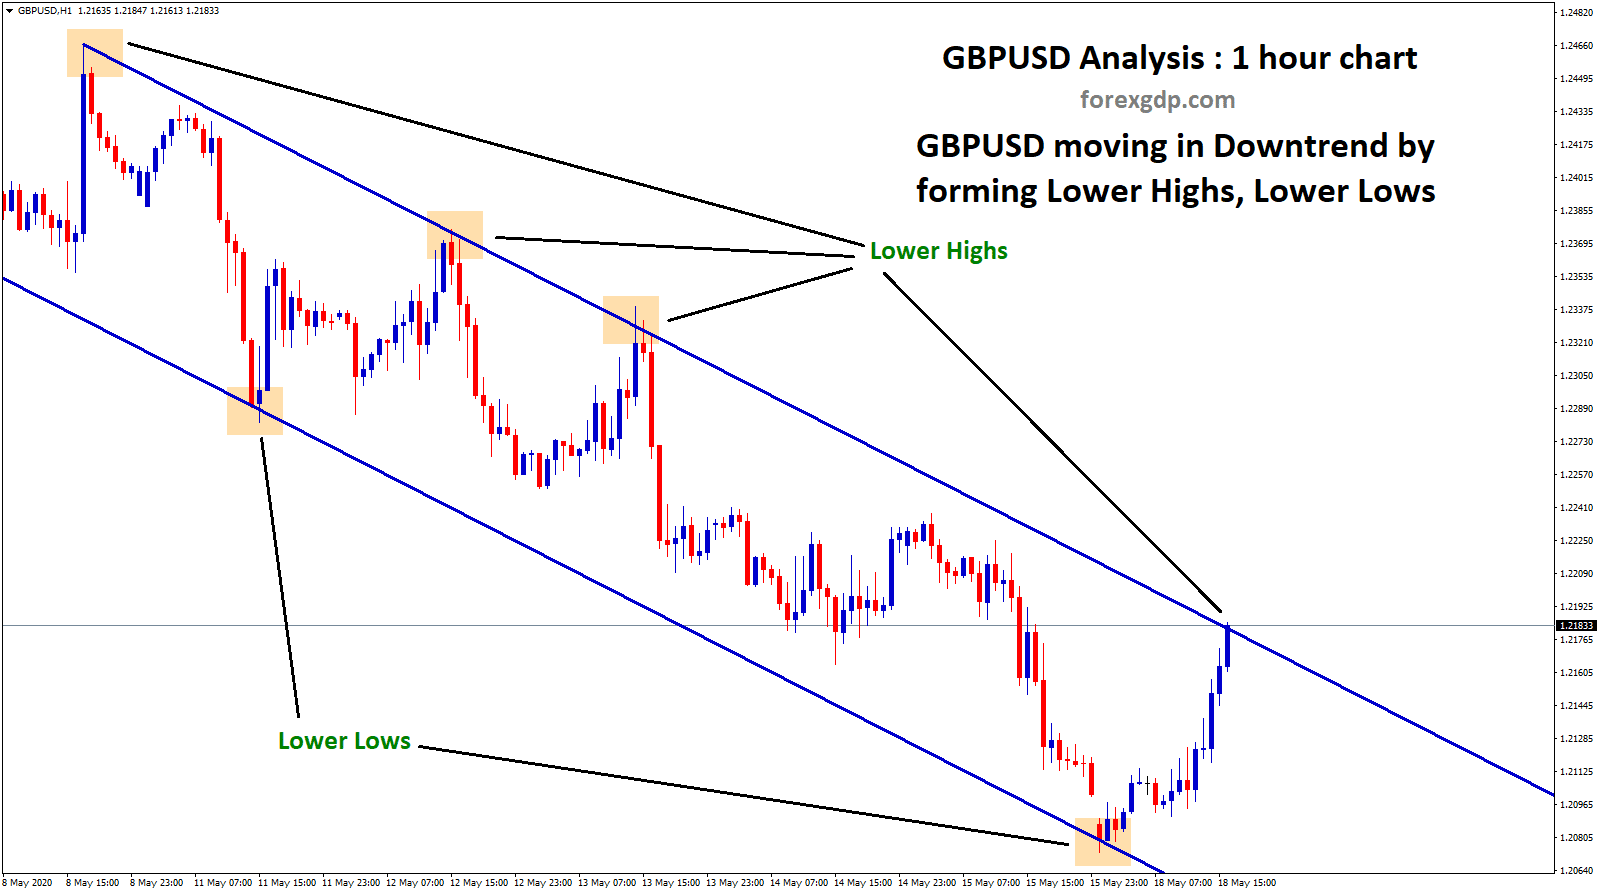
Now, GBPUSD is still moving in downtrend by forming Lower Highs, Lower Lows.
In 1 hour chart, Sellers still pushing the market down.
On other side, EURGBP broken the resistance zone after long time, it shows that GBP is getting weaker at this time.
Check live Free forex signals now.