Gold XAU/USD Chart Analysis
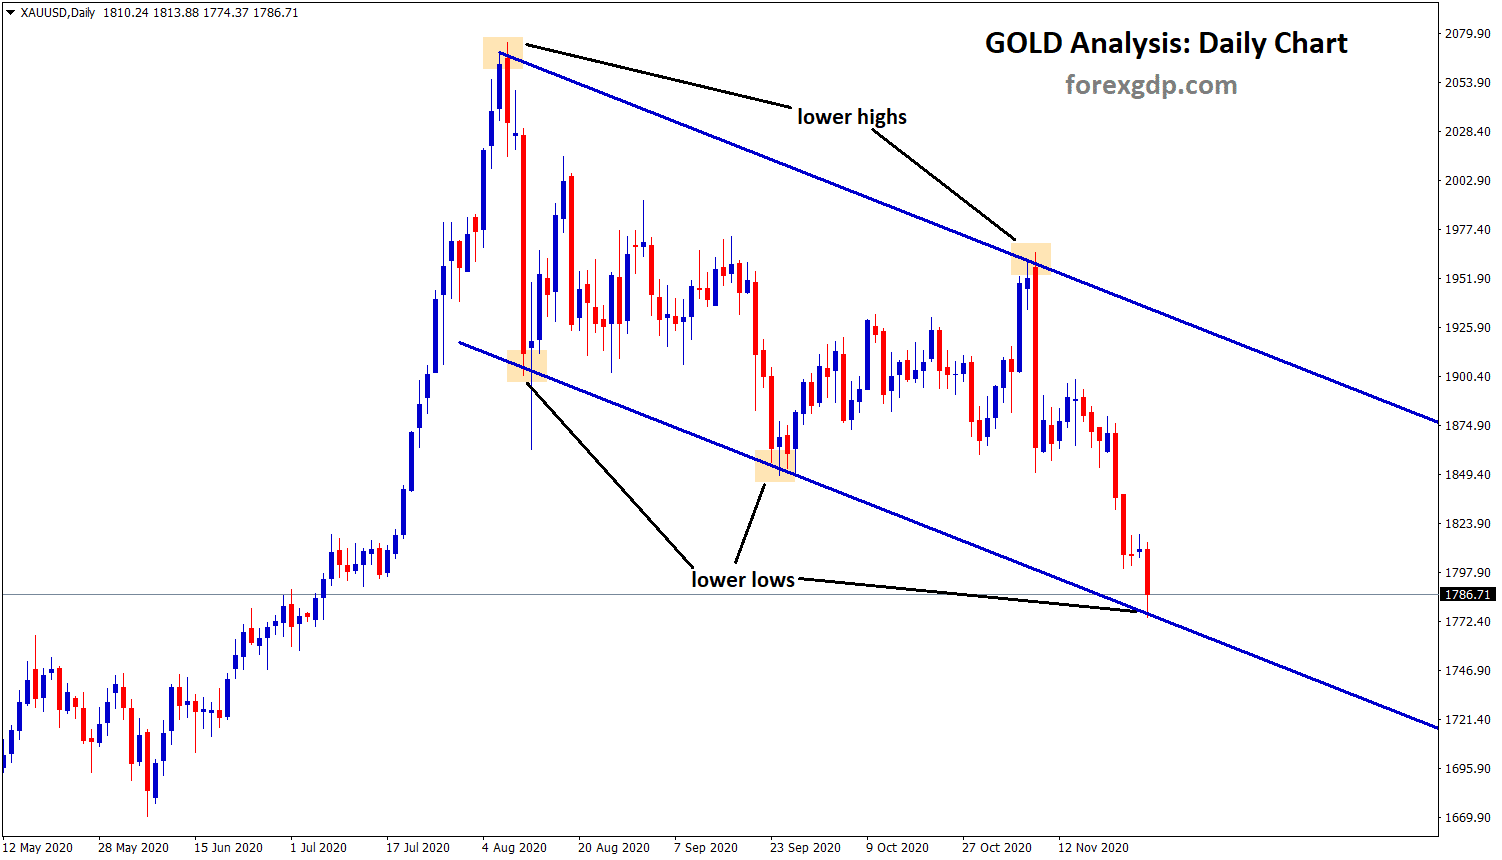
Gold is moving in a downtrend by forming lower highs and lower lows in the daily time frame chart.
In our previous analysis, we recommend our users to sell Gold. check here.
Now, Gold has reached the lower low zone of the downtrend line.
Let’s wait for the confirmation of reversal or breakout.

Gold has declined below 1800$ mark as Vaccine optimism and Trade war may end as per the expectations from the new Biden administration.
If the stimulus program passed in Biden administration then Gold may reverse to the positive tone.
What happens If gold price continues to fall further?
In the 4-hour chart, Gold has broken the bottom of the descending Triangle.

As per the descending Triangle breakout strategy, the maximum target after the breakout will be the first swing of the triangle.
We have highlighted the first swing inside the descending Triangle, and duplicated the first swing distance and applied it to the breakout area to see the maximum target market have chances to move.
The first swing length (pips) = Target length.
Gold can fall maximum until 1700 price level as per the descending triangle breakout strategy.
how to set the maximum take profit for the patterns? and how to trade these breakout chart patterns? check now.
Get Each trading signal with Chart Analysis and Reason for buying or selling the trade which helps you to Trade with confidence on your trading account.
Want to boost your profits in trading? Get the best trading signals at an accurate time. Try now: forexgdp.com/forex-signals/