Gold XAU/USD Chart Analysis
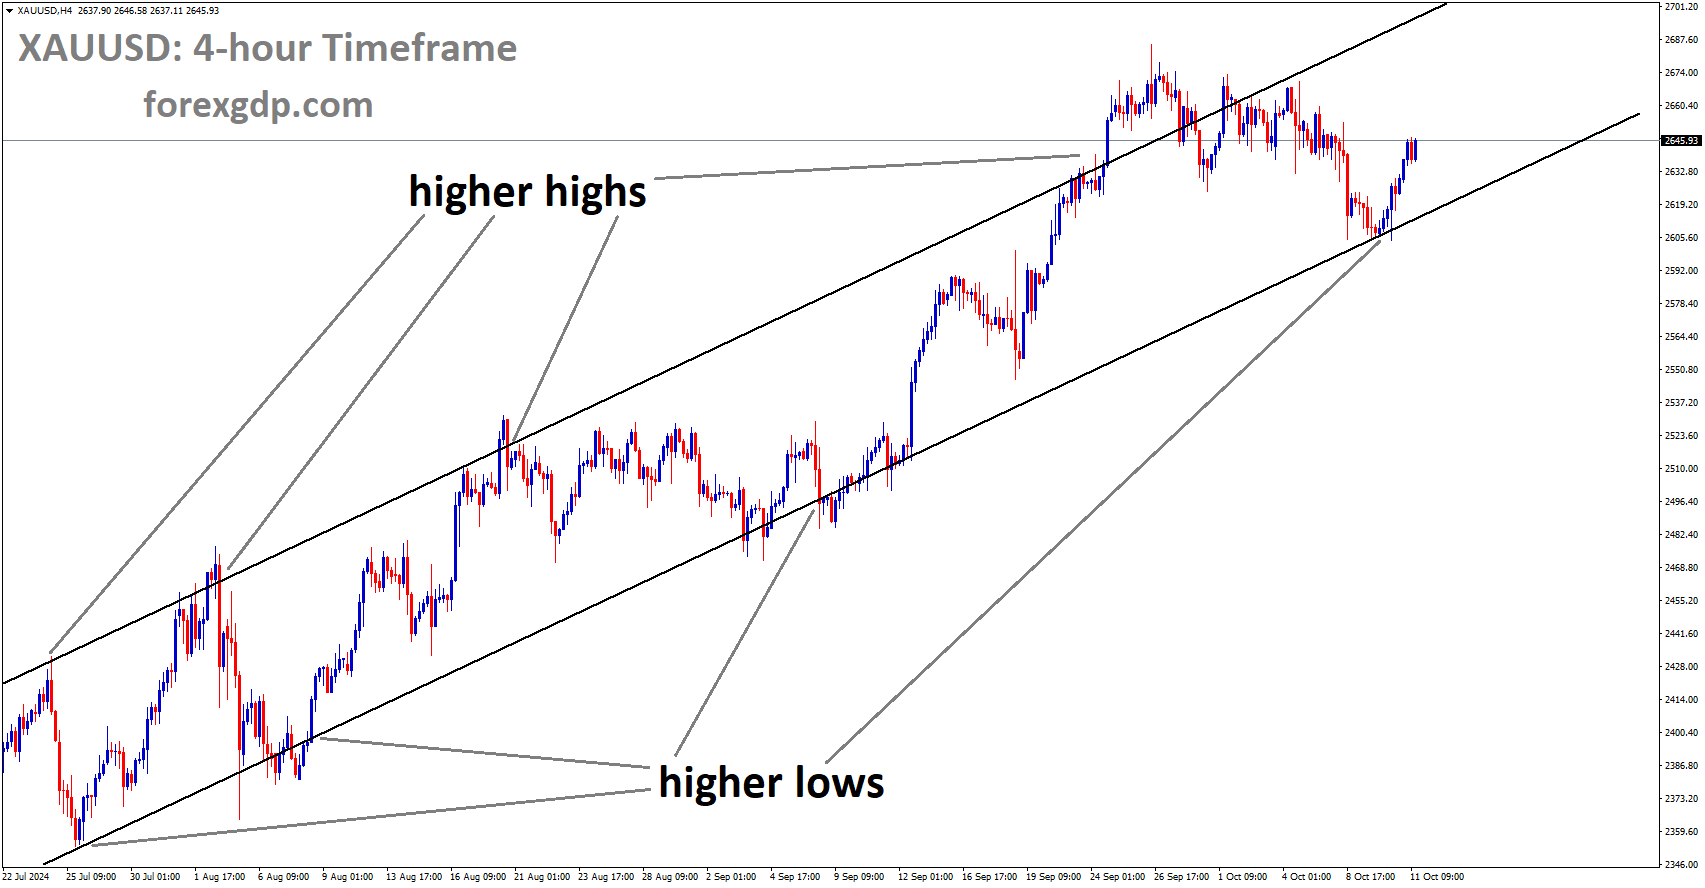
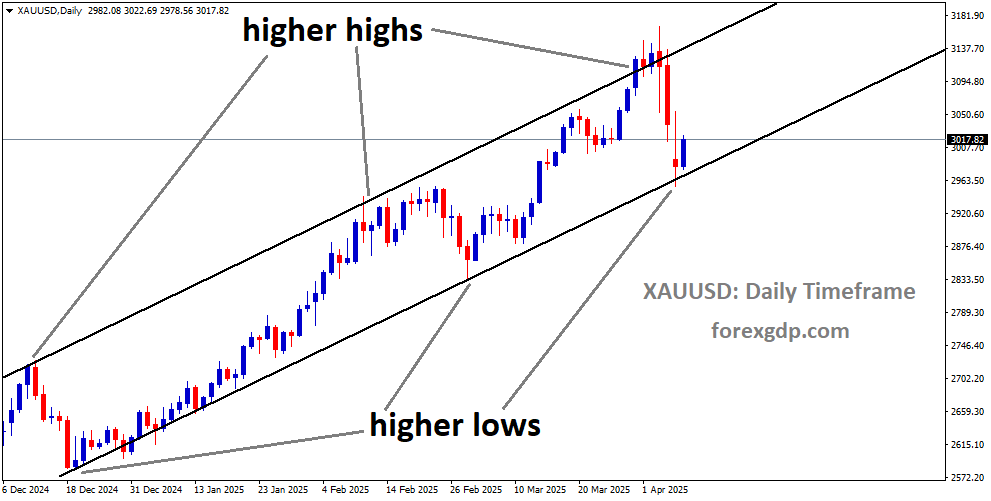
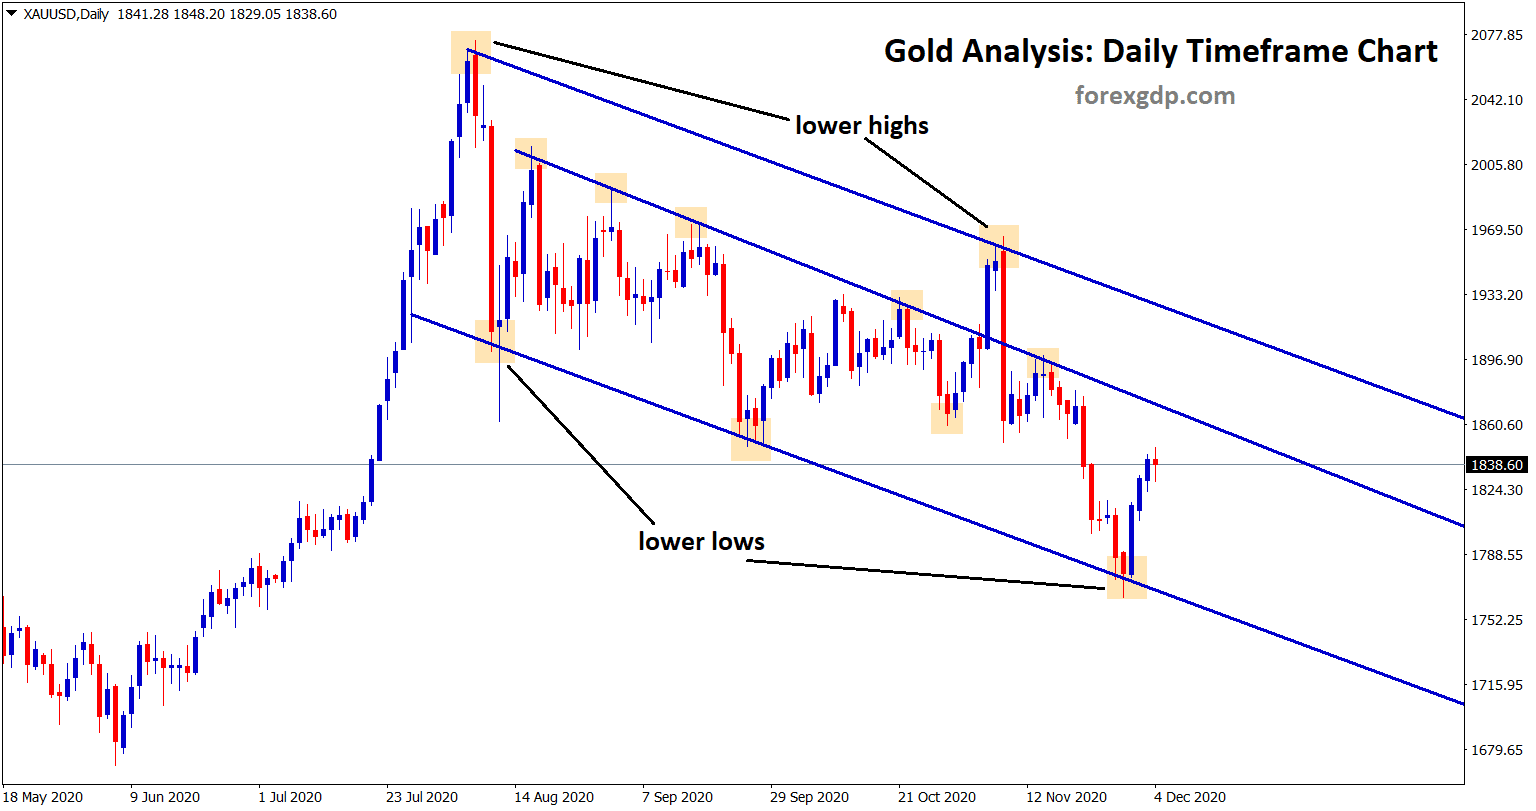
Gold is moving in a downtrend by forming lower highs and lower lows in the daily time frame chart.
In our previous analysis, we recommend our users to wait for the reversal to buy gold at lower low zone. check here.
Now, Gold has started to bounce back from the lower low zone of the downtrend line.
How long gold price will rise now?
Gold has recently broken the bottom level of the Descending Triangle in the daily time frame chart.

After the breakout, the gold price is coming back to the retest zone of the descending Triangle.
Let’s wait for the gold to retest the broken level of the triangle at 1850 and you can expect some corrections (downward move) from there.

Gold prices seem to climb higher as US dollar weakness. December month FED meeting shows a dovish stance until 2023.
Big Investors are moved for higher yield assets than US dollar with lower interest rates.
Still few more days left for Inauguration day of new U.S President Biden.
Get Each trading signal with Chart Analysis and Reason for buying or selling the trade which helps you to Trade with confidence on your trading account.
Want to boost your profits in trading? Get the best trading signals at an accurate time. Try premium or supreme signals now: forexgdp.com/forex-signals/