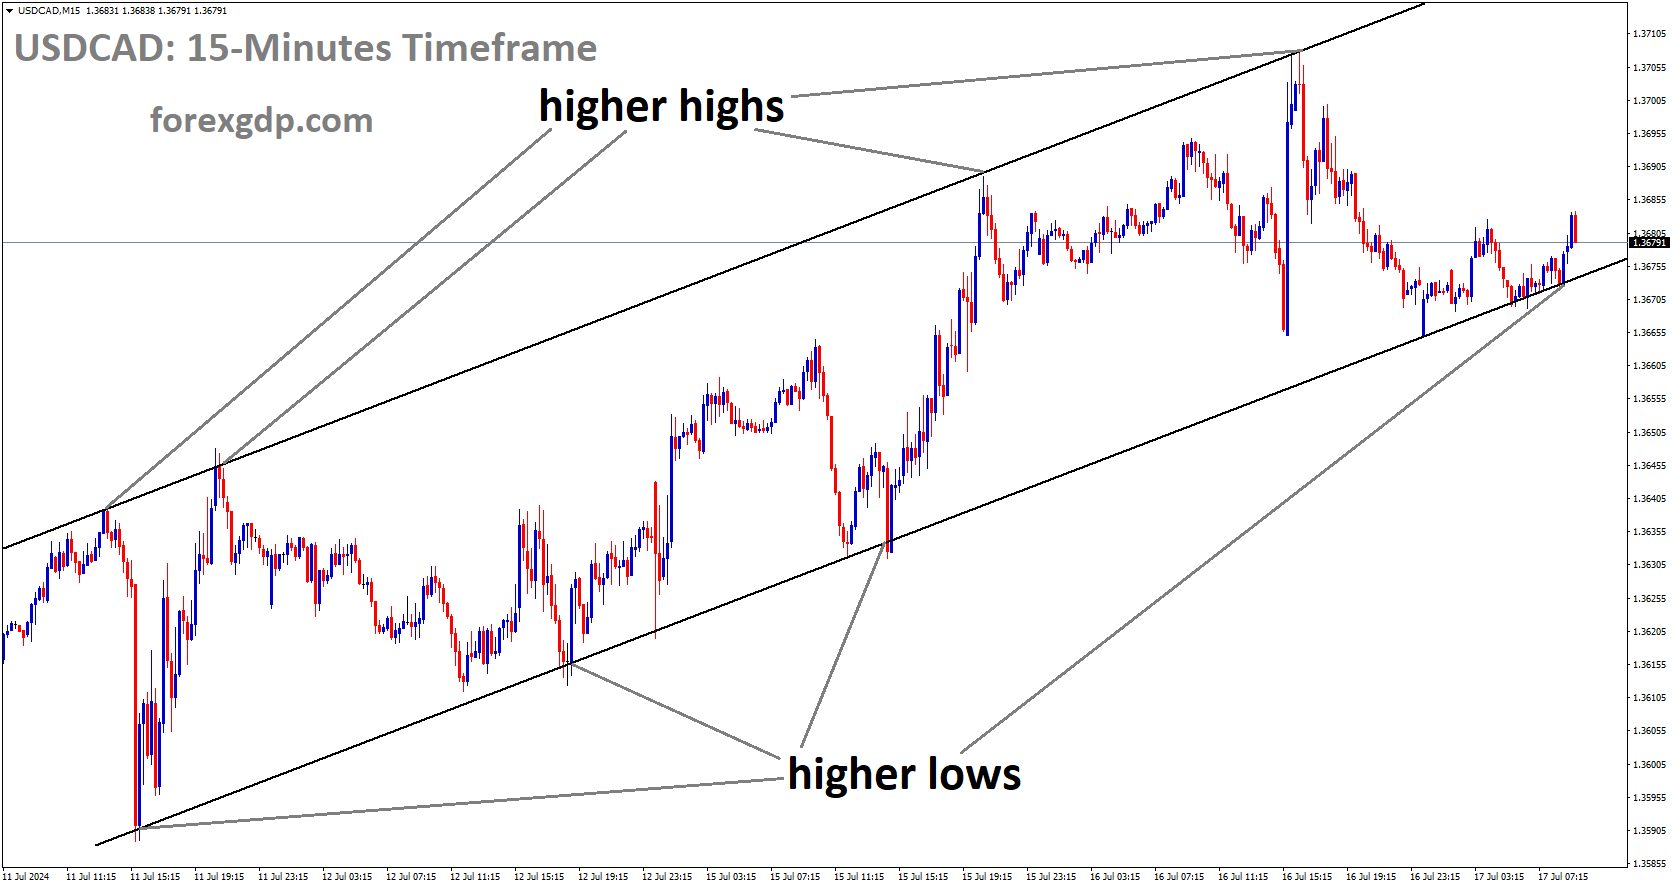
USD/CAD Slips Below 1.3700 as Fed Rate Cut Speculations Intensify
USDCAD is moving in Ascending channel and market has reached higher low area of the channel USD/CAD Faces Mild Losses…
read more....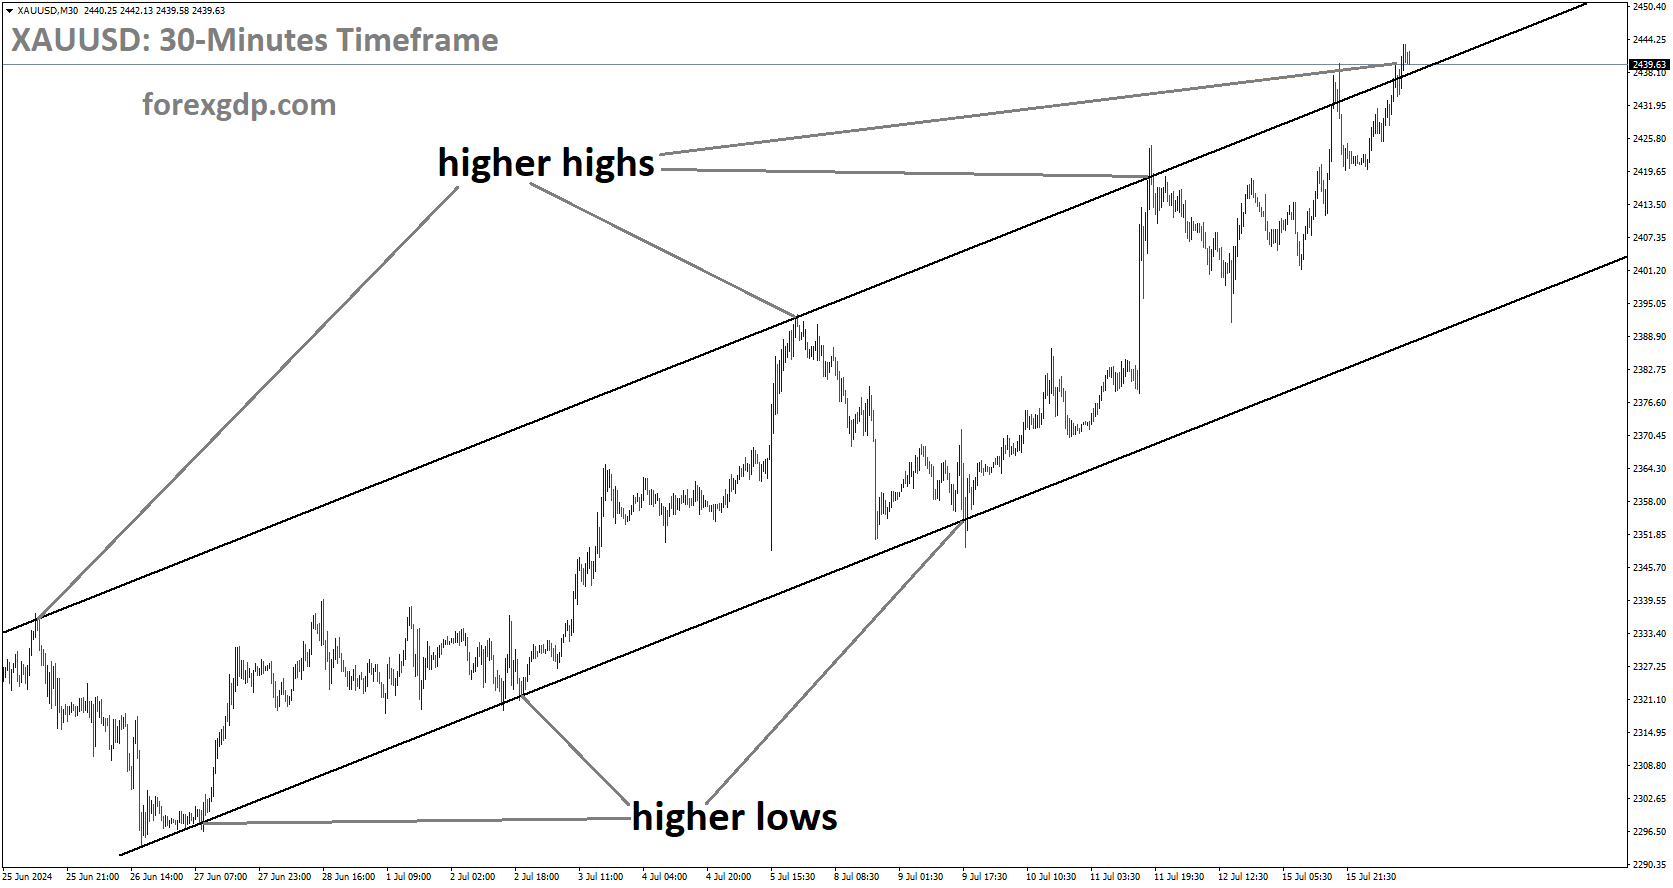
Fed Chairman’s Words Propel Gold to New Heights
XAUUSD is moving in Ascending channel and market has reached higher high area of the channel Gold Surges Amid Fed's…
read more....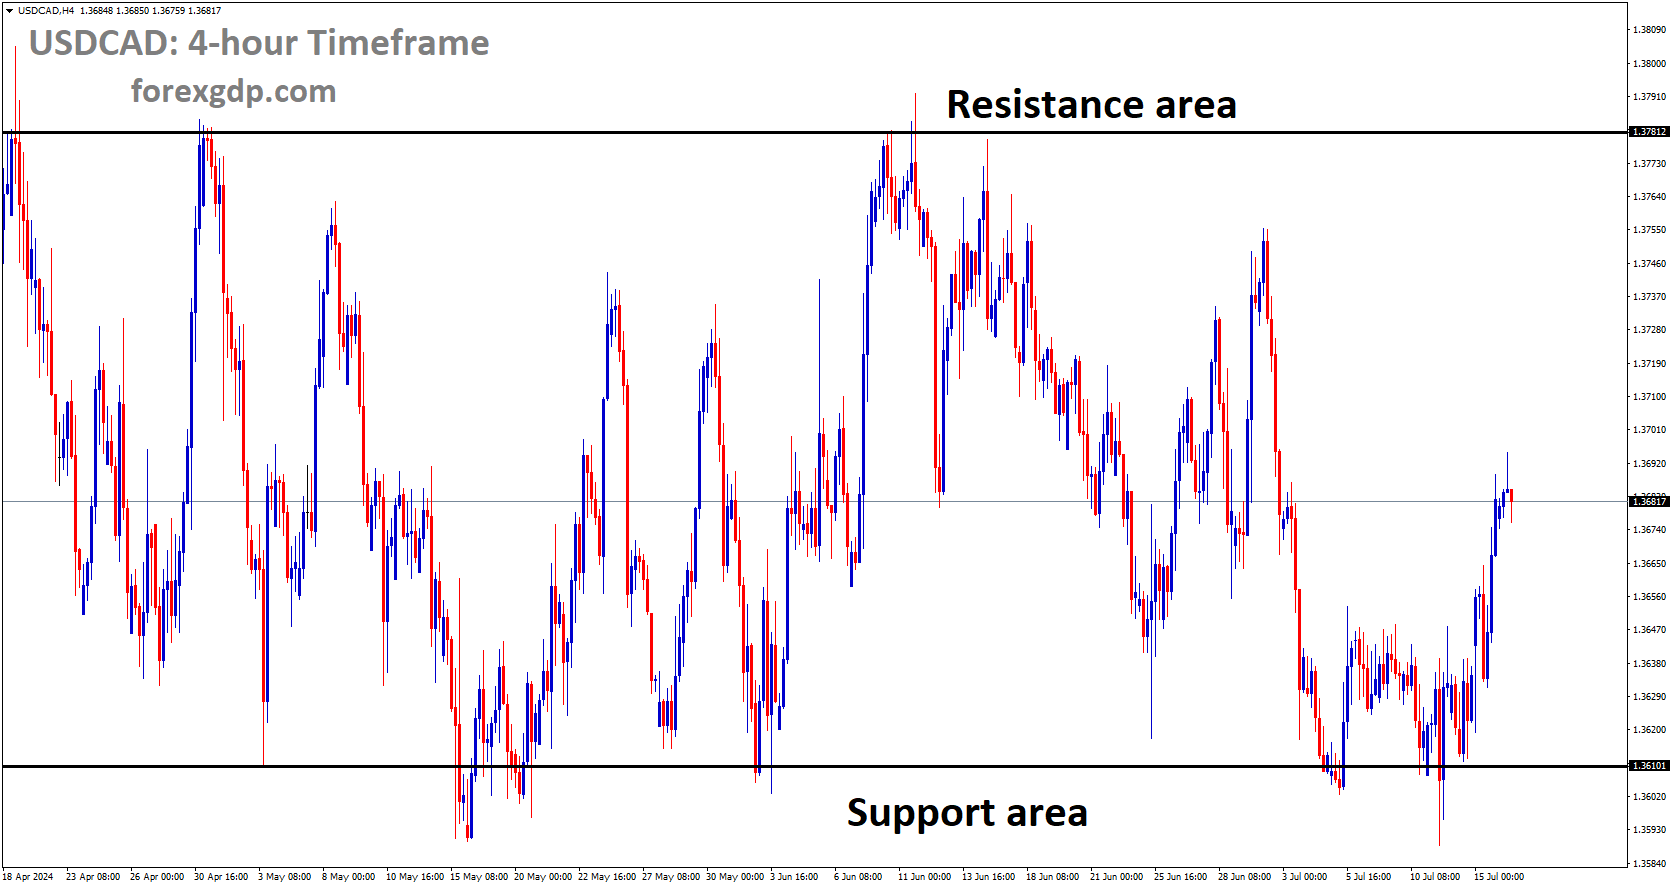
Oil Price Drop Propels USD/CAD to Nearly 1.3700
USDCAD is moving in box pattern and market has rebounded from the support area of the pattern USD/CAD Extends Gains…
read more....
Australian Dollar Drops While US Dollar Strengthens: Retail Sales Awaited
AUDUSD has broken Ascending channel in downside Australian Dollar Slumps Amid China's Economic Concerns and US Dollar Rebound China's Economic…
read more....
WTI Faces Pressure but Downside Risks Are Capped
XTIUSD is moving in Symmetrical Triangle and market has fallen from the lower high area of the pattern WTI Slips…
read more....
US Dollar Edges Up as Markets Anticipate Powell’s Next Move
USD Index Market price is moving in Descending channel and market has reached lower high area of the channel US…
read more....
GBP/USD Clings to 1.2950, Near Highest Levels in Over a Year
GBPUSD is moving in Ascending channel and market has fallen from the higher high area of the channel GBP/USD Finds…
read more....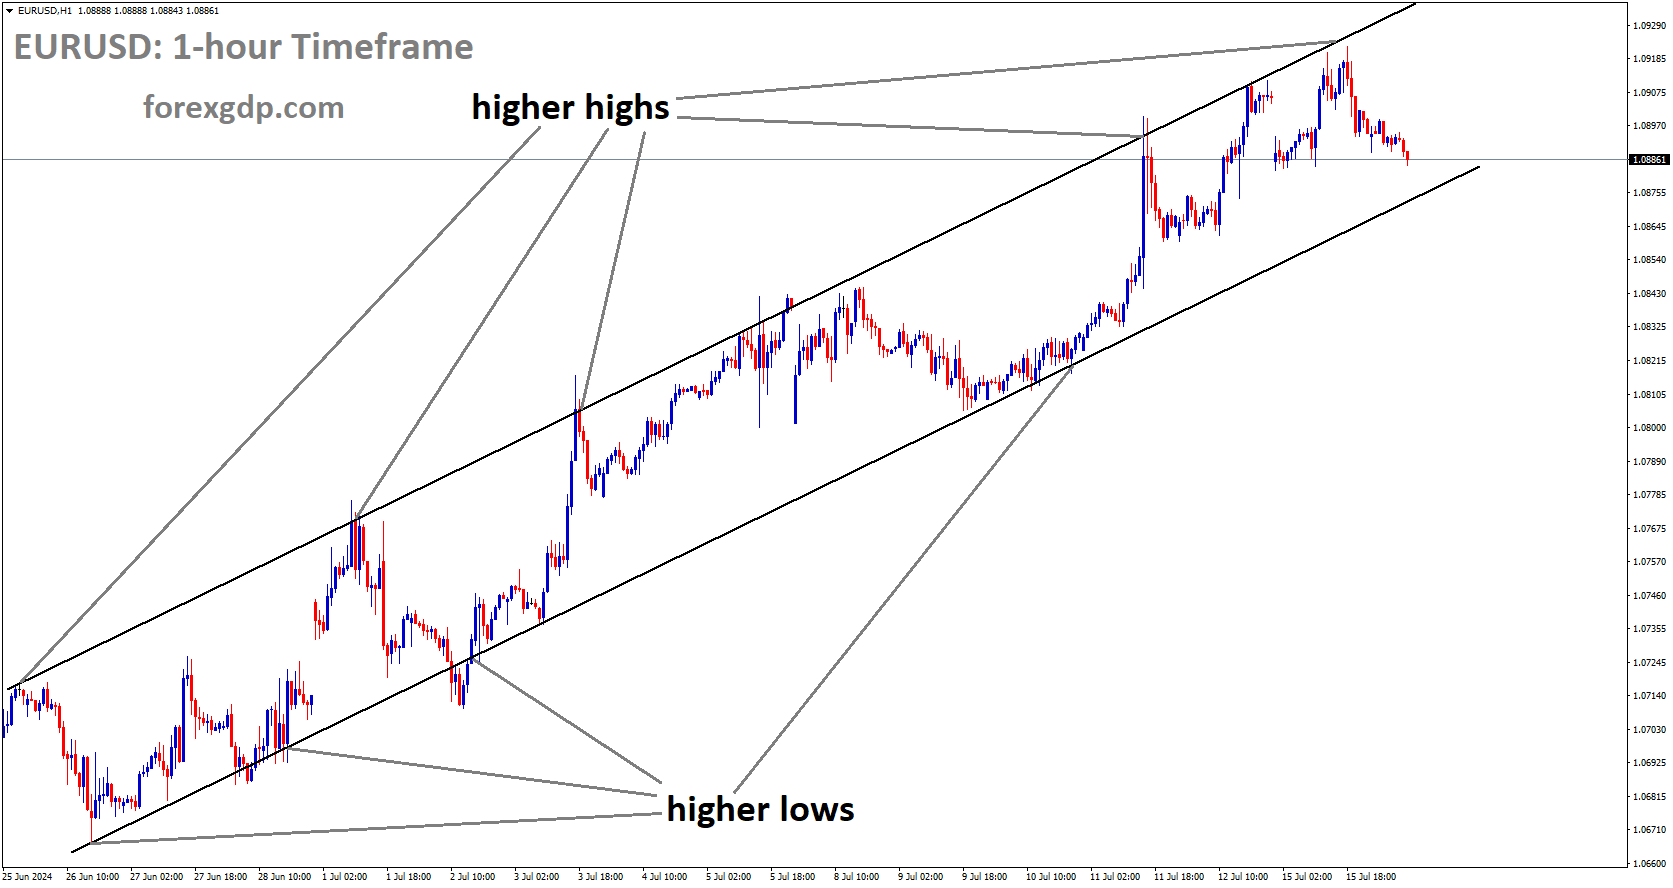
EUR/USD Hesitates as ECB Rate Decision Approaches
EURUSD is moving in Ascending channel and market has fallen from the higher high area of the channel EUR/USD Struggles…
read more....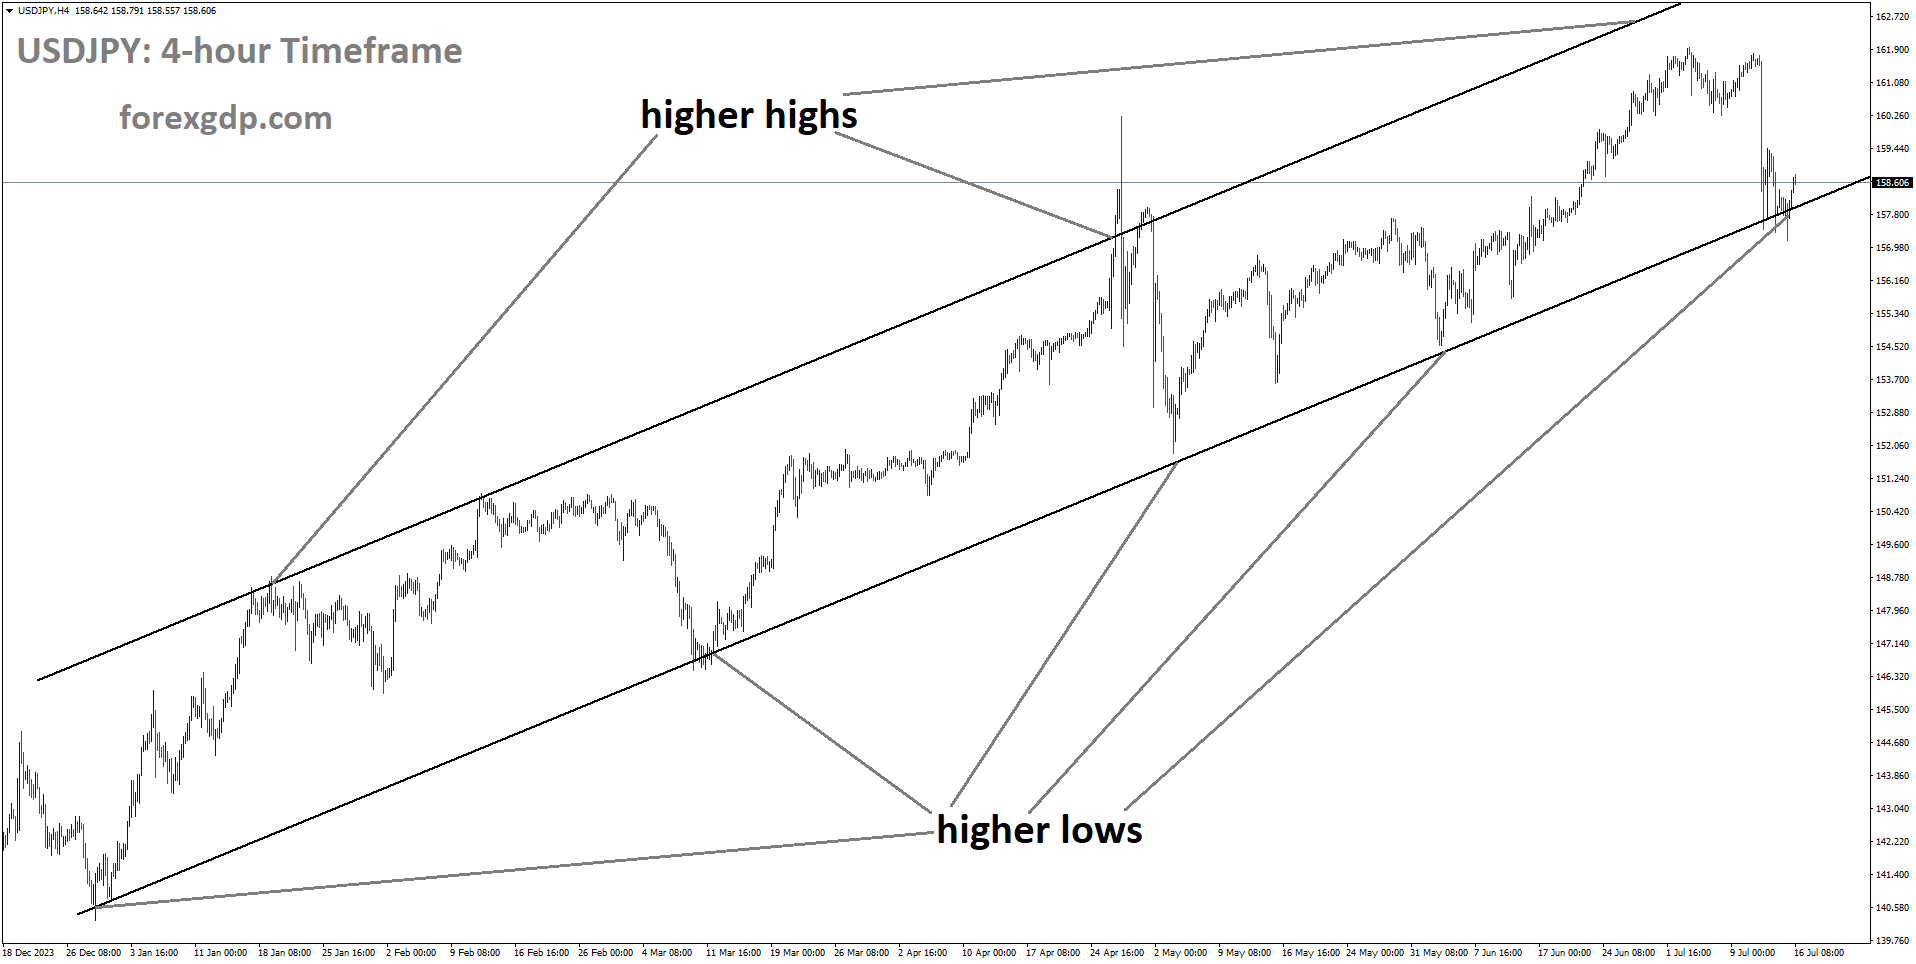
Yen Flatlines Amid Intervention Fears, US Retail Sales Anticipation
USDJPY is moving in Ascending channel and market has reached higher low area of the channel The Japanese Yen: What’s…
read more....
Trump’s Shooting Sparks US Dollar Surge in Asia
USD Index Market price is moving in box pattern and market has reached support area of the pattern US Dollar…
read more....
GBP Gains Momentum on Fed Rate Cut Buzz, UK Reports Awaited
GBPUSD is moving in Ascending channel and market has reached higher high area of the channel Pound Sterling on the…
read more....
Gold Dips as Dollar Gains, Limited Downside Ahead
XAUUSD is moving in box pattern and market has reached resistance area of the pattern Gold Price Faces Headwinds Amid…
read more....