Forex Market Analysis for Education Purpose
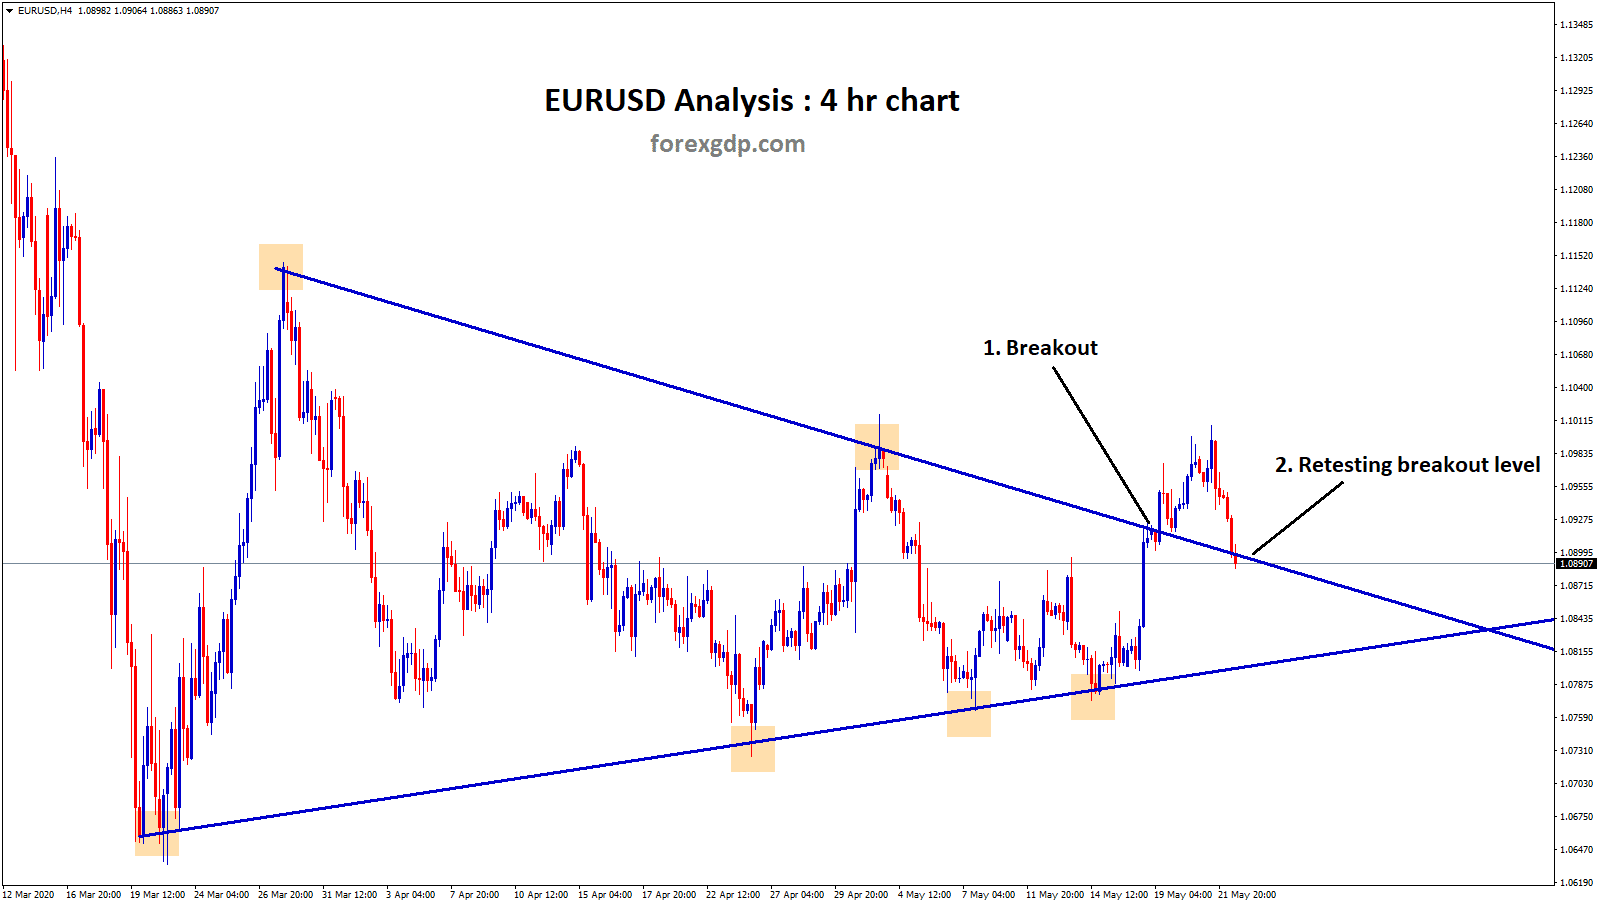
EURUSD retesting the Triangle breakout level
EURUSD broken the top level of the Symmetrical Triangle recently, check here.
After breakout market went up around 80 pips and came to retest the breakout level.
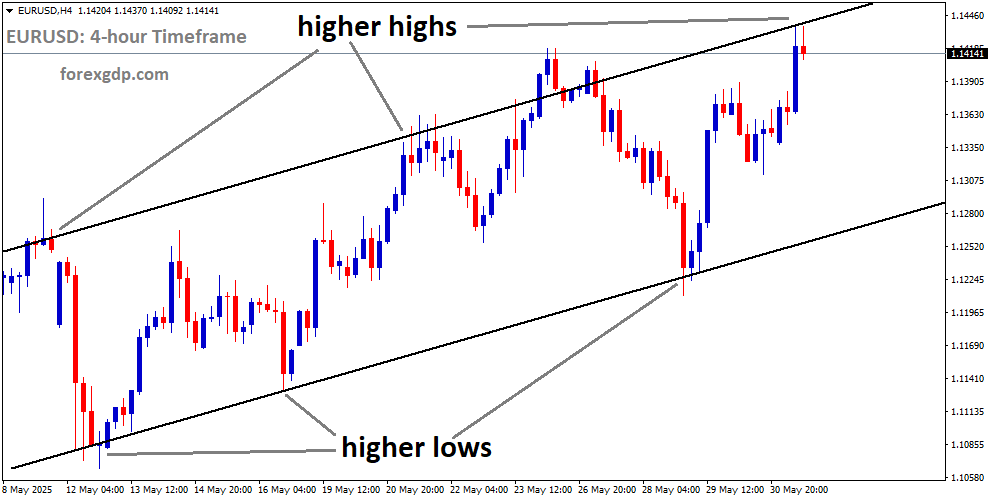
CADJPY Trend Analysis in 4 hour chart
CADJPY starts to move in an Uptrend by forming Higher Highs, higher lows in 4 hr chart.
Now, market reached the support level of Up trend line.

Due to the correction in crude oil price, CAD currency made a correction.

We are waiting for breakout of USDCAD Descending Triangle pattern for picking up the long term trade.
As crude oil price movement impacting CAD currency to get weak or strong. it’s following a strong correlation at this lock down period too.
Let’s wait for the confirmation of good trade setup.
Check live Free forex signals now.
To increase your trading profits, read this below topics:
How to trade profitably using Chart Patterns?
Low risk, High reward trading strategies
How to get rich trading forex market?
Most predictable Currency Markets
If you want to learn more successful trading techniques with free mentorship support, you can purchase the forex trading video course.
Thank you.
Thanx for the power full setup and signal