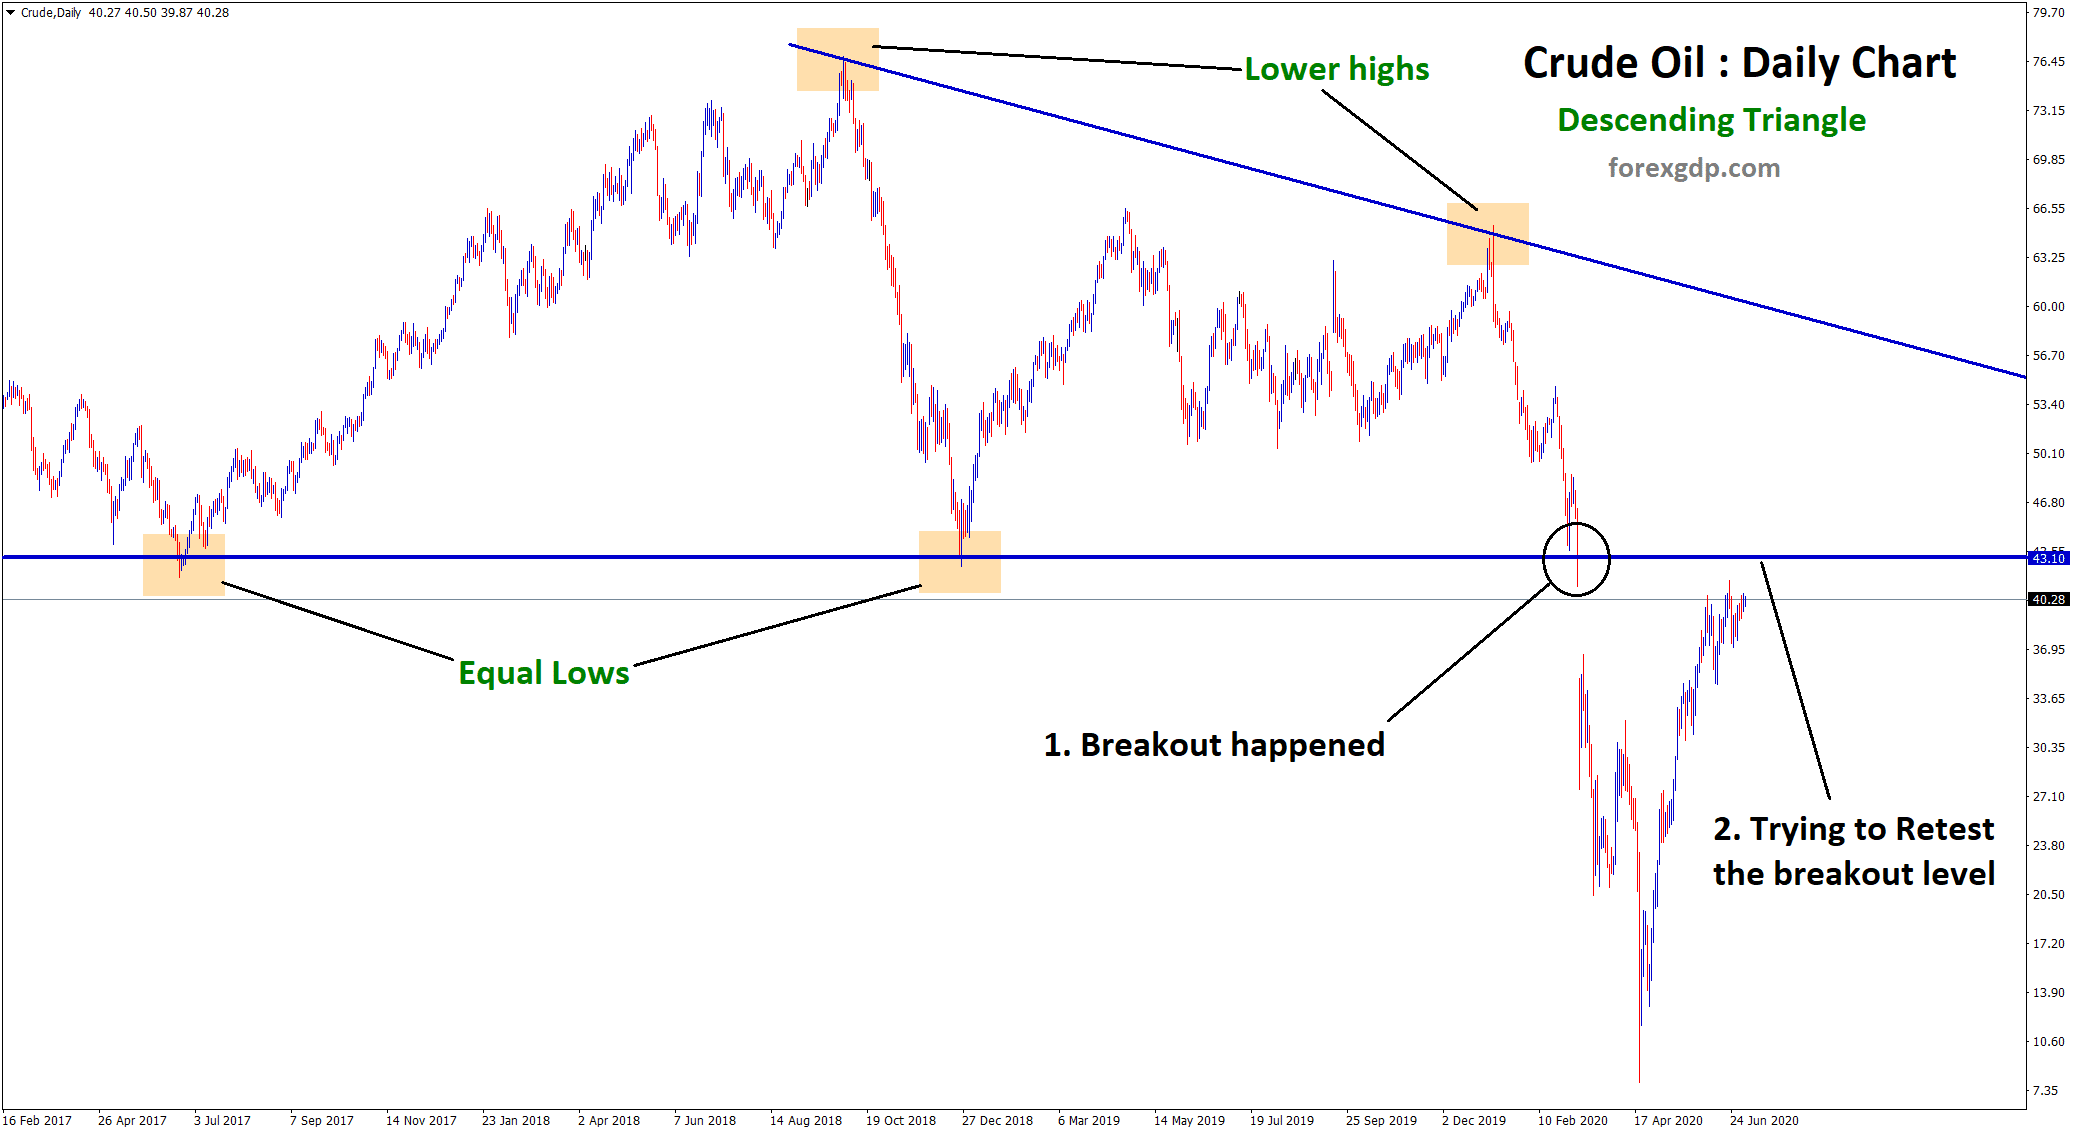
Crude Oil Price Chart Analysis
Crude oil has recovered from the historical fall and trading now around $40 per barrel.
Technically, Breakout happened at the bottom level of the Descending Triangle Pattern in the Daily Timeframe chart.
After the breakout, Now Crude oil market recovered well and trying to retest the breakout level of descending Triangle.
Coronavirus still dominates the world harder, if the second wave of virus spread continues, it will affect the world economies harder than ever.
In the United States, nearly 54,904 new cases recorded yesterday with new deaths of 616 people.
US jobs growth jumped in June, but the USD still suffers harder due to the rise of new corona cases.
Boosting recovery hopes, a private survey showed on Friday that China’s services sector expanded at the fastest pace in over a decade in June.
OPEC oil production fell to its lowest in decades in June and Russian production has dropped to near its OPEC+ target.
The bankruptcy filing of U.S. shale pioneer Chesapeake Energy also supported prices by raising expectations production will decline, JBC Energy said in a report.
Gasoline demand will be closely watched as the United States heads into the July 4 holiday weekend.
Crude oil still has the risk of falling again, If the 2nd wave of corona starts to dominate the world.
Save your time on analyzing the market and take your trades only at good opportunities available in the market.
If you want to receive forex trading signals at best trade setup with chart analysis, subscribe now to our forex signals.