
Author: FOREX GDP
-
FOMC today – Gold at Resistance, USDJPY broken Triangle
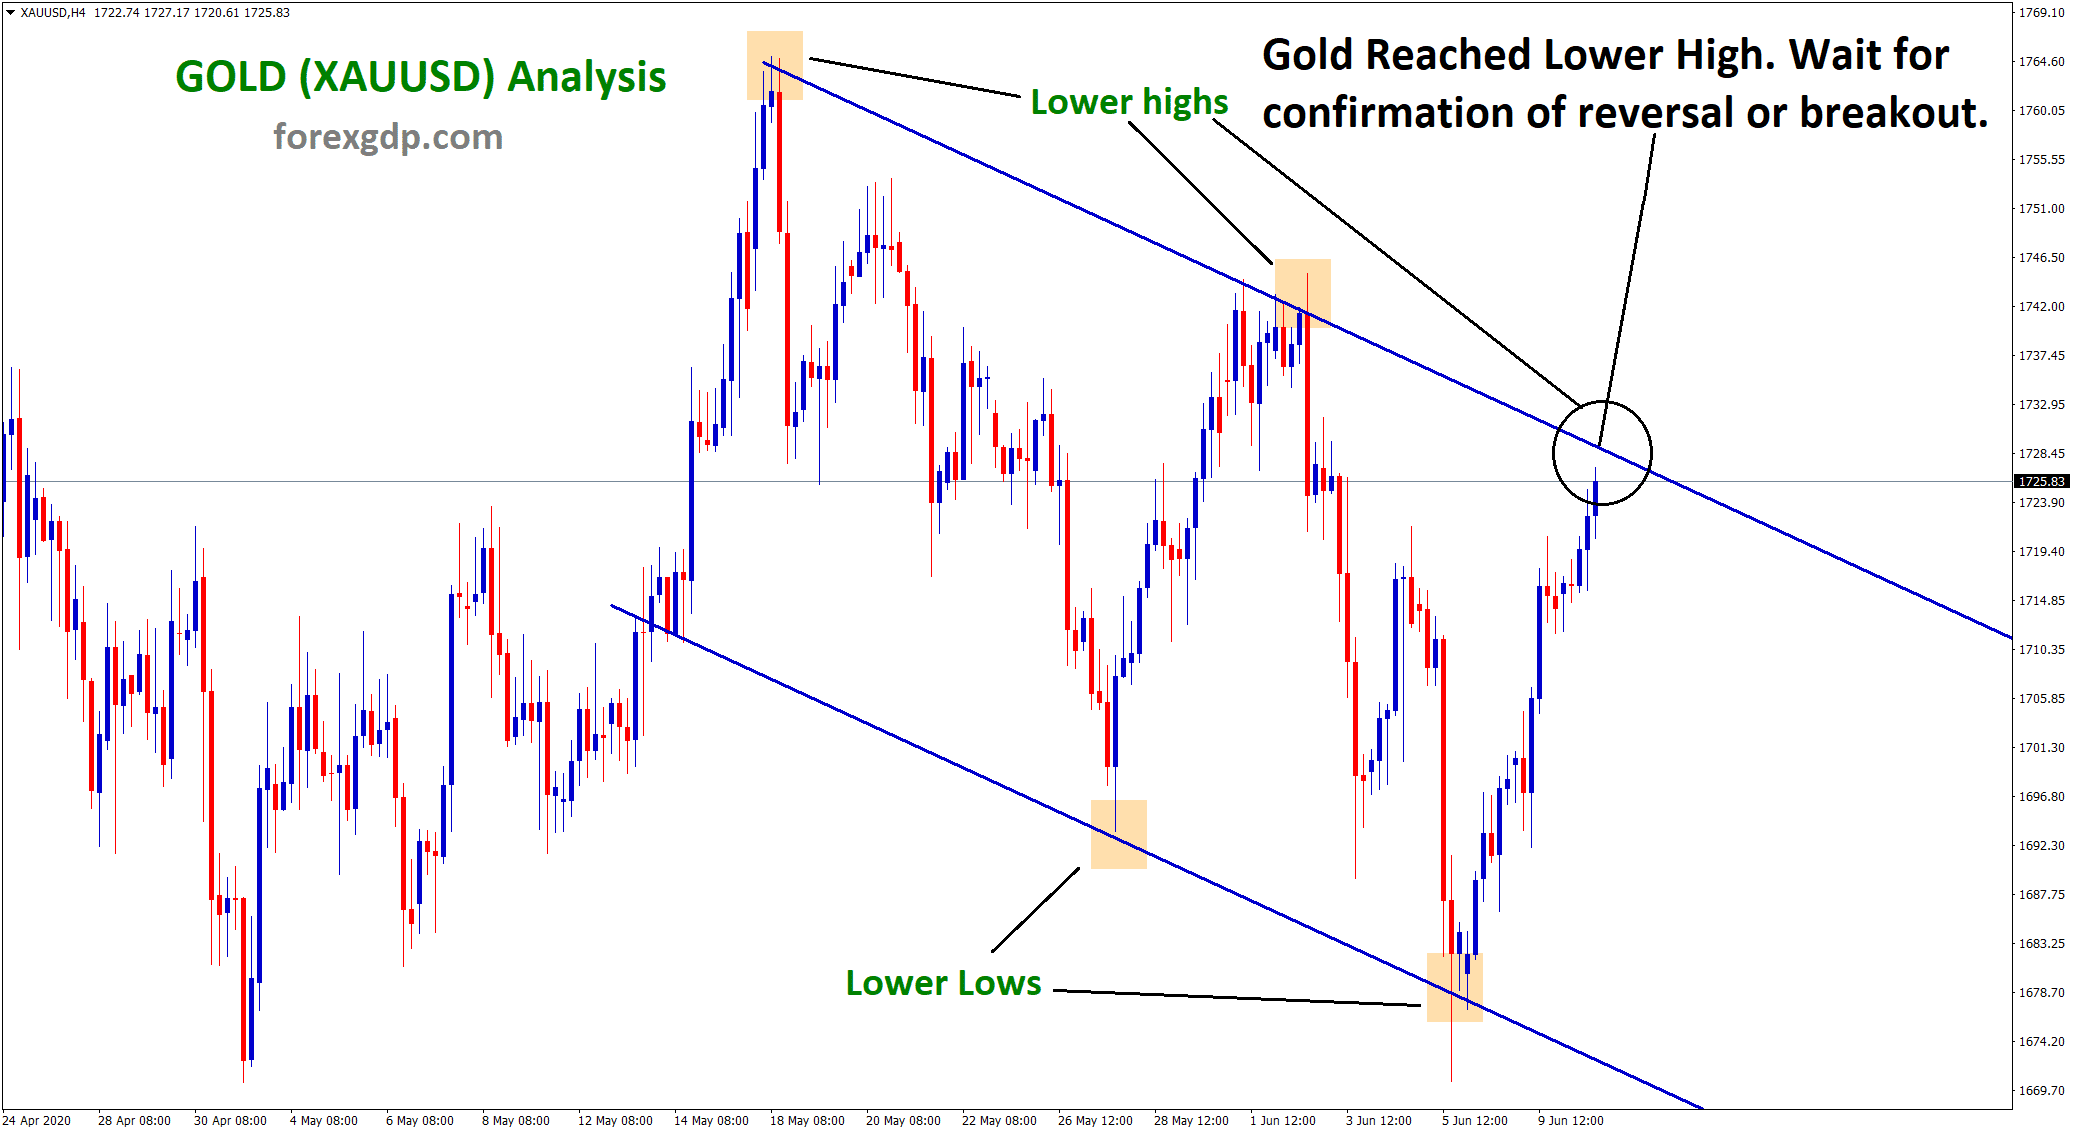
Gold is moving in a downtrend by forming lower highs, lower lows in 4-hour chart. Now the market is going…
-
AUDJPY Resistance Reversal in Daily Chart?
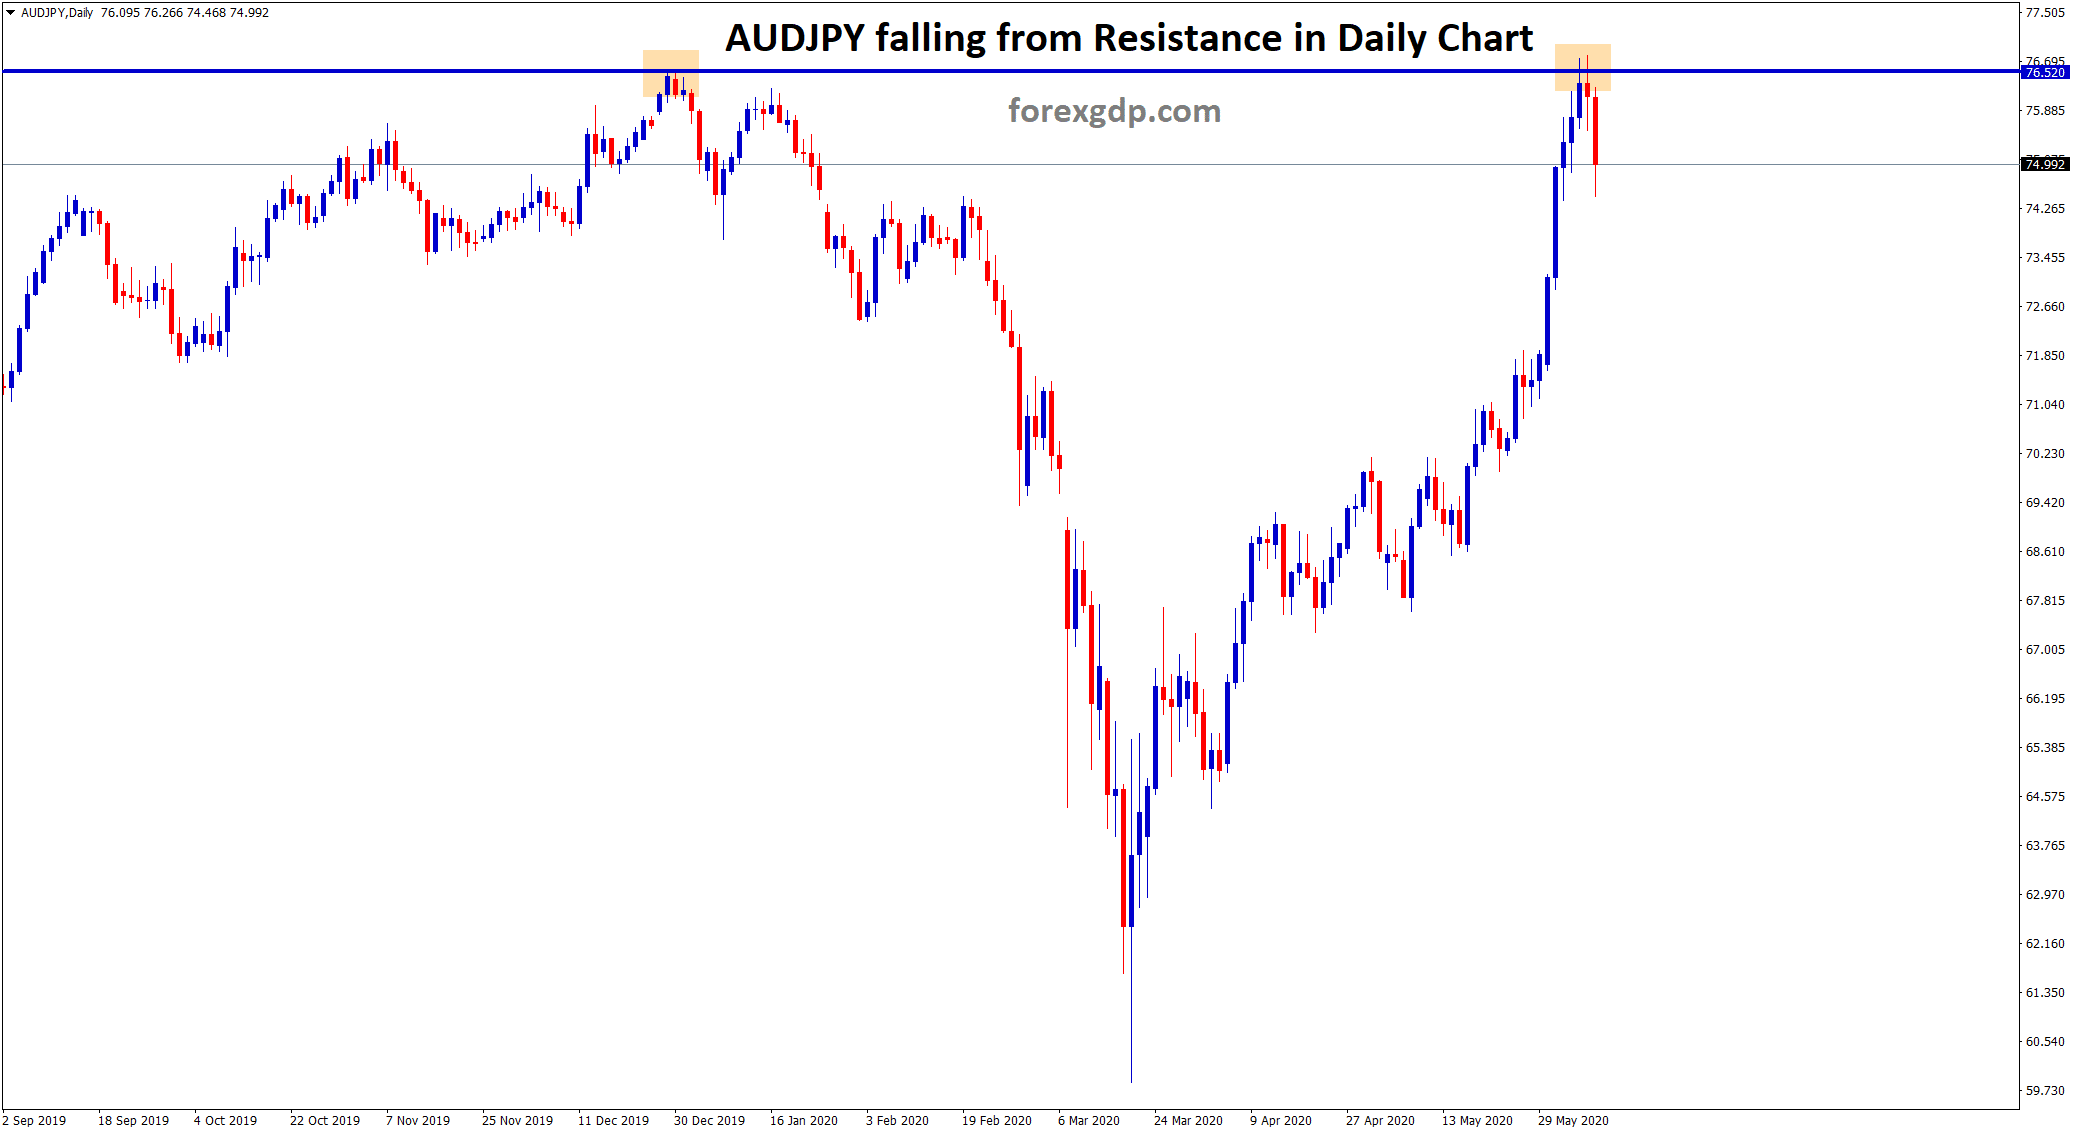
AUDJPY Falling from the Resistance Zone AUDJPY is moving up continuously for long time without much corrections. Now, AUDJPY Starts…
-
GBPUSD broke the top levels in Ascending Triangle and Trendline
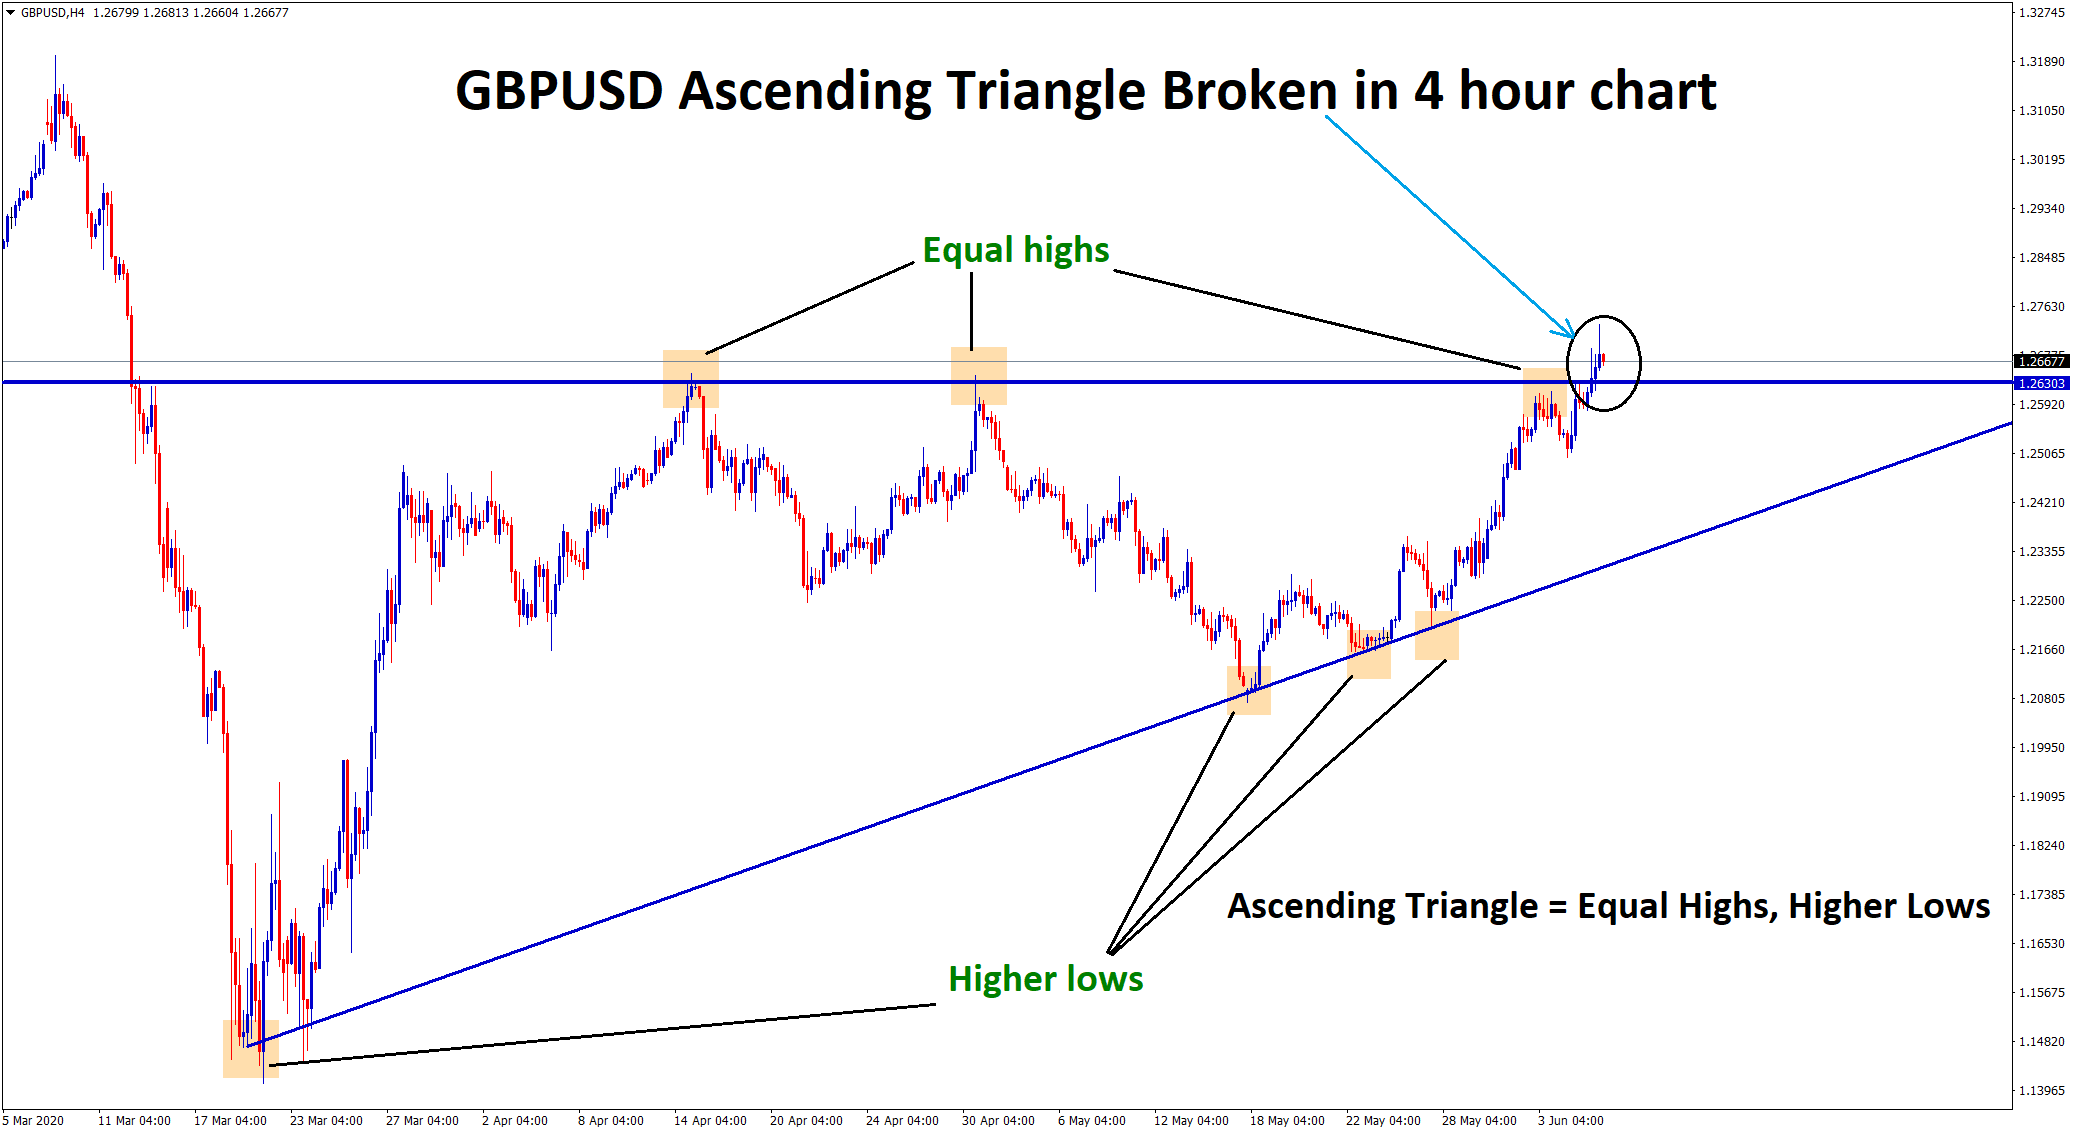
GBPUSD Ascending Triangle pattern GBPUSD formed Equal highs, higher lows in 4-hour chart which creates an Ascending Triangle pattern. Recently…
-
AUDNZD forming higher highs higher lows
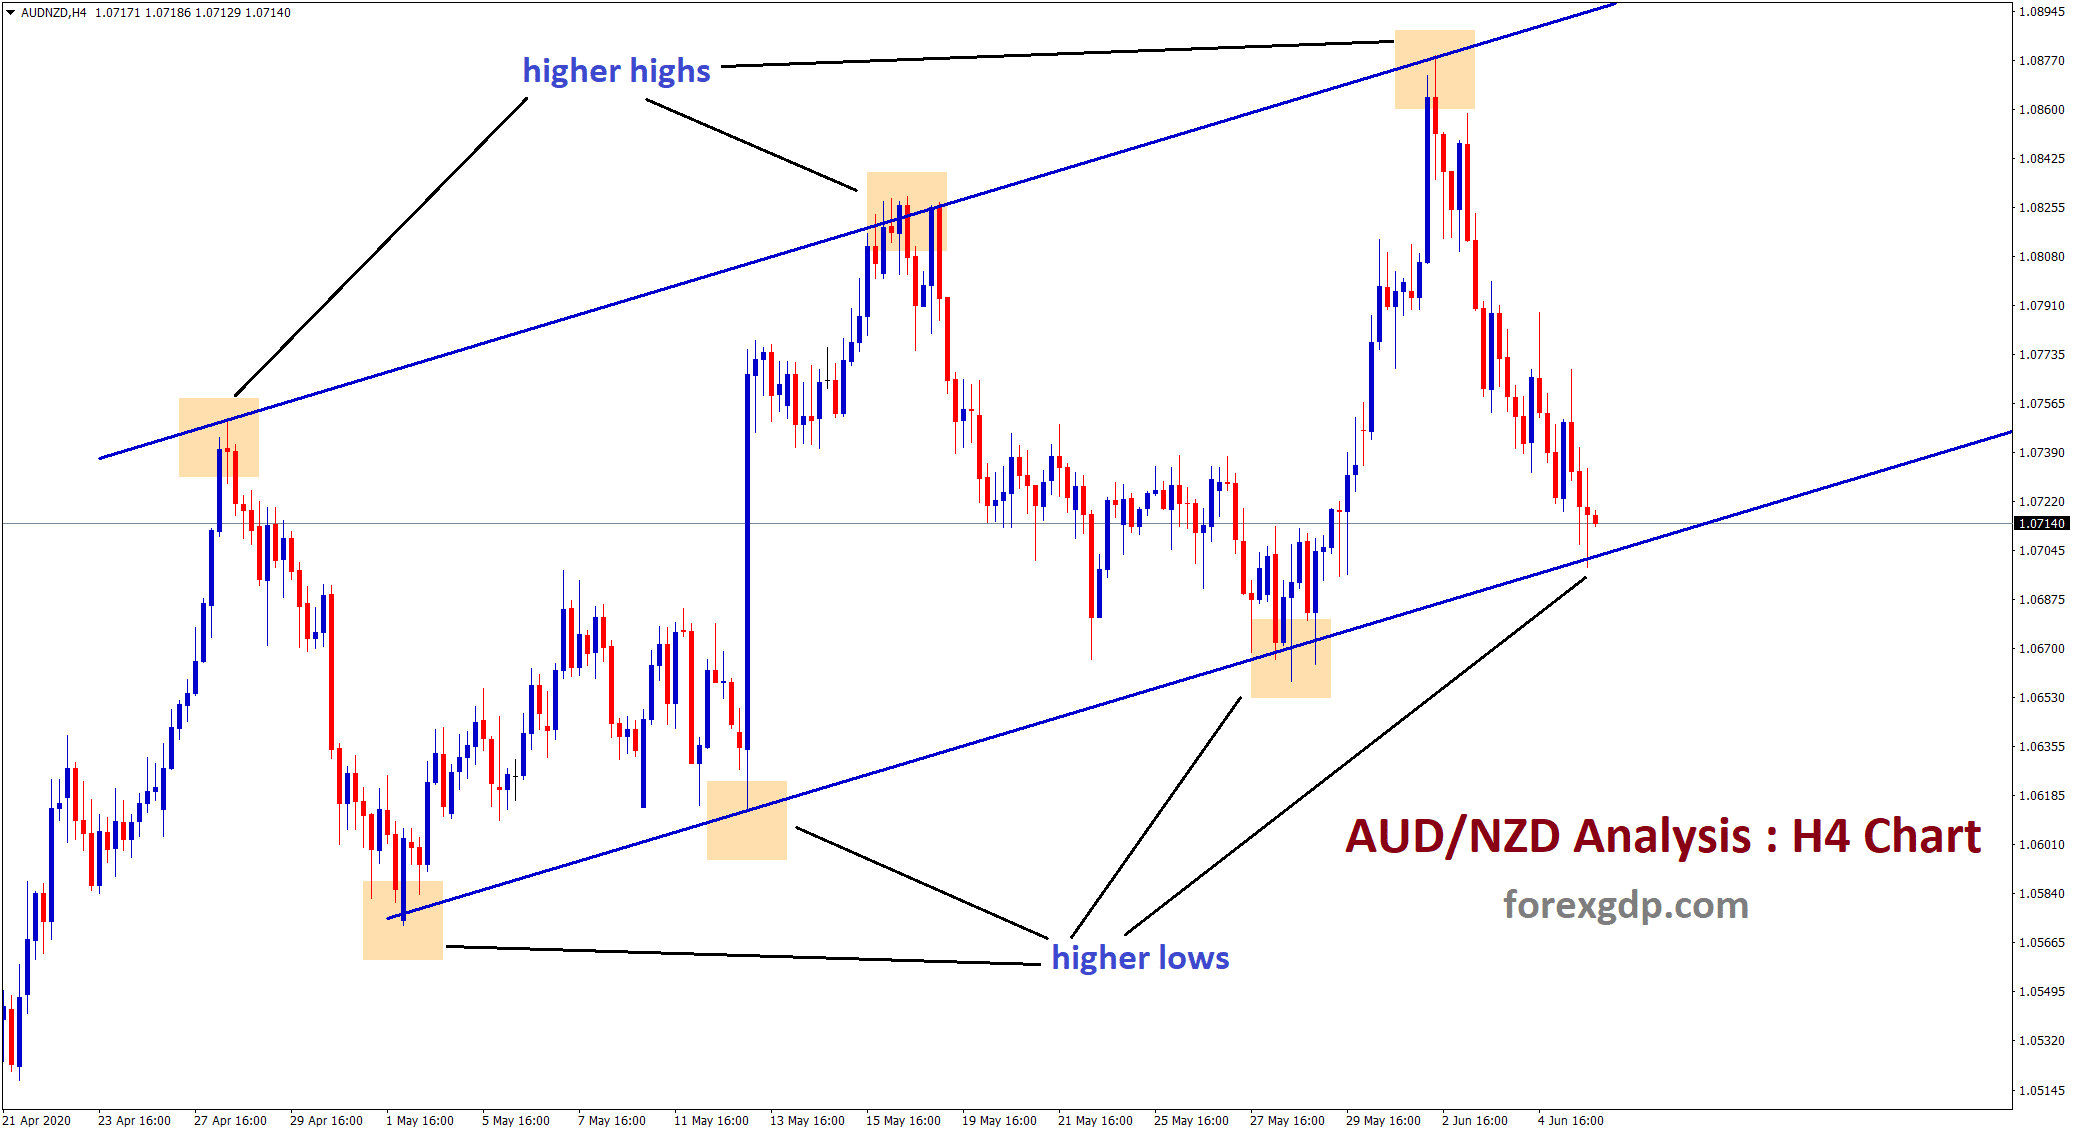
AUDNZD Up Trend Line Analysis AUDNZD is moving in a strong uptrend in H4 chart. Higher high, higher low forming…
-
ECB pushing EURO higher. After 4 months, EURAUD hits the Support.
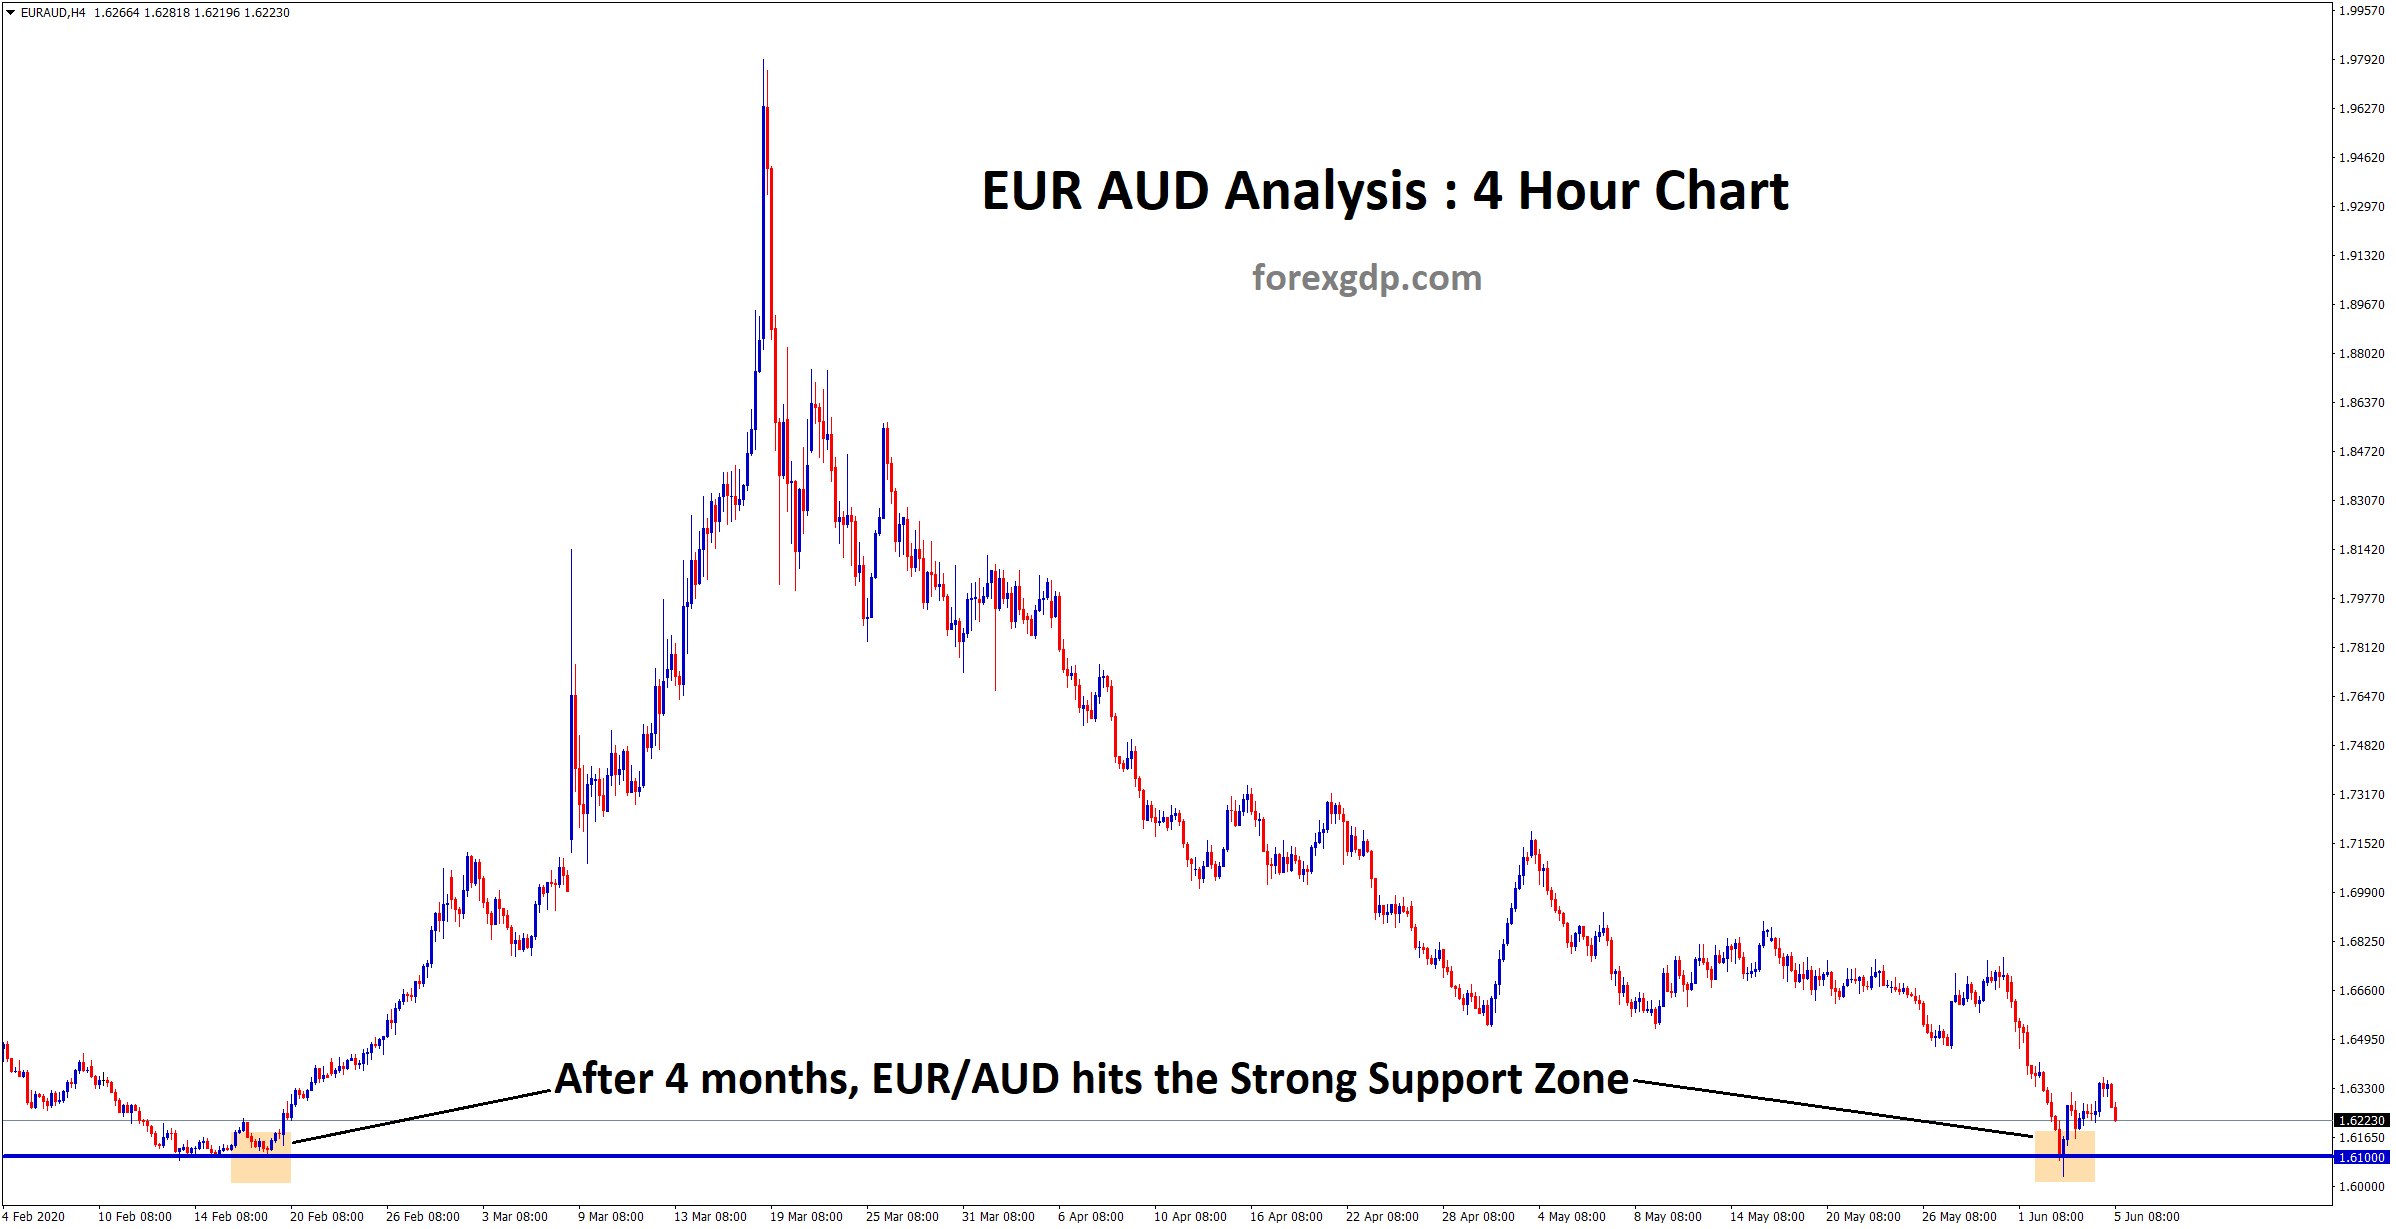
EURAUD Support Zone Analysis In 4 hour chart, EURAUD hits the strong support zone after a long time of 4…
-
EURGBP standing at the bottom level of horizontal SR and Trend line
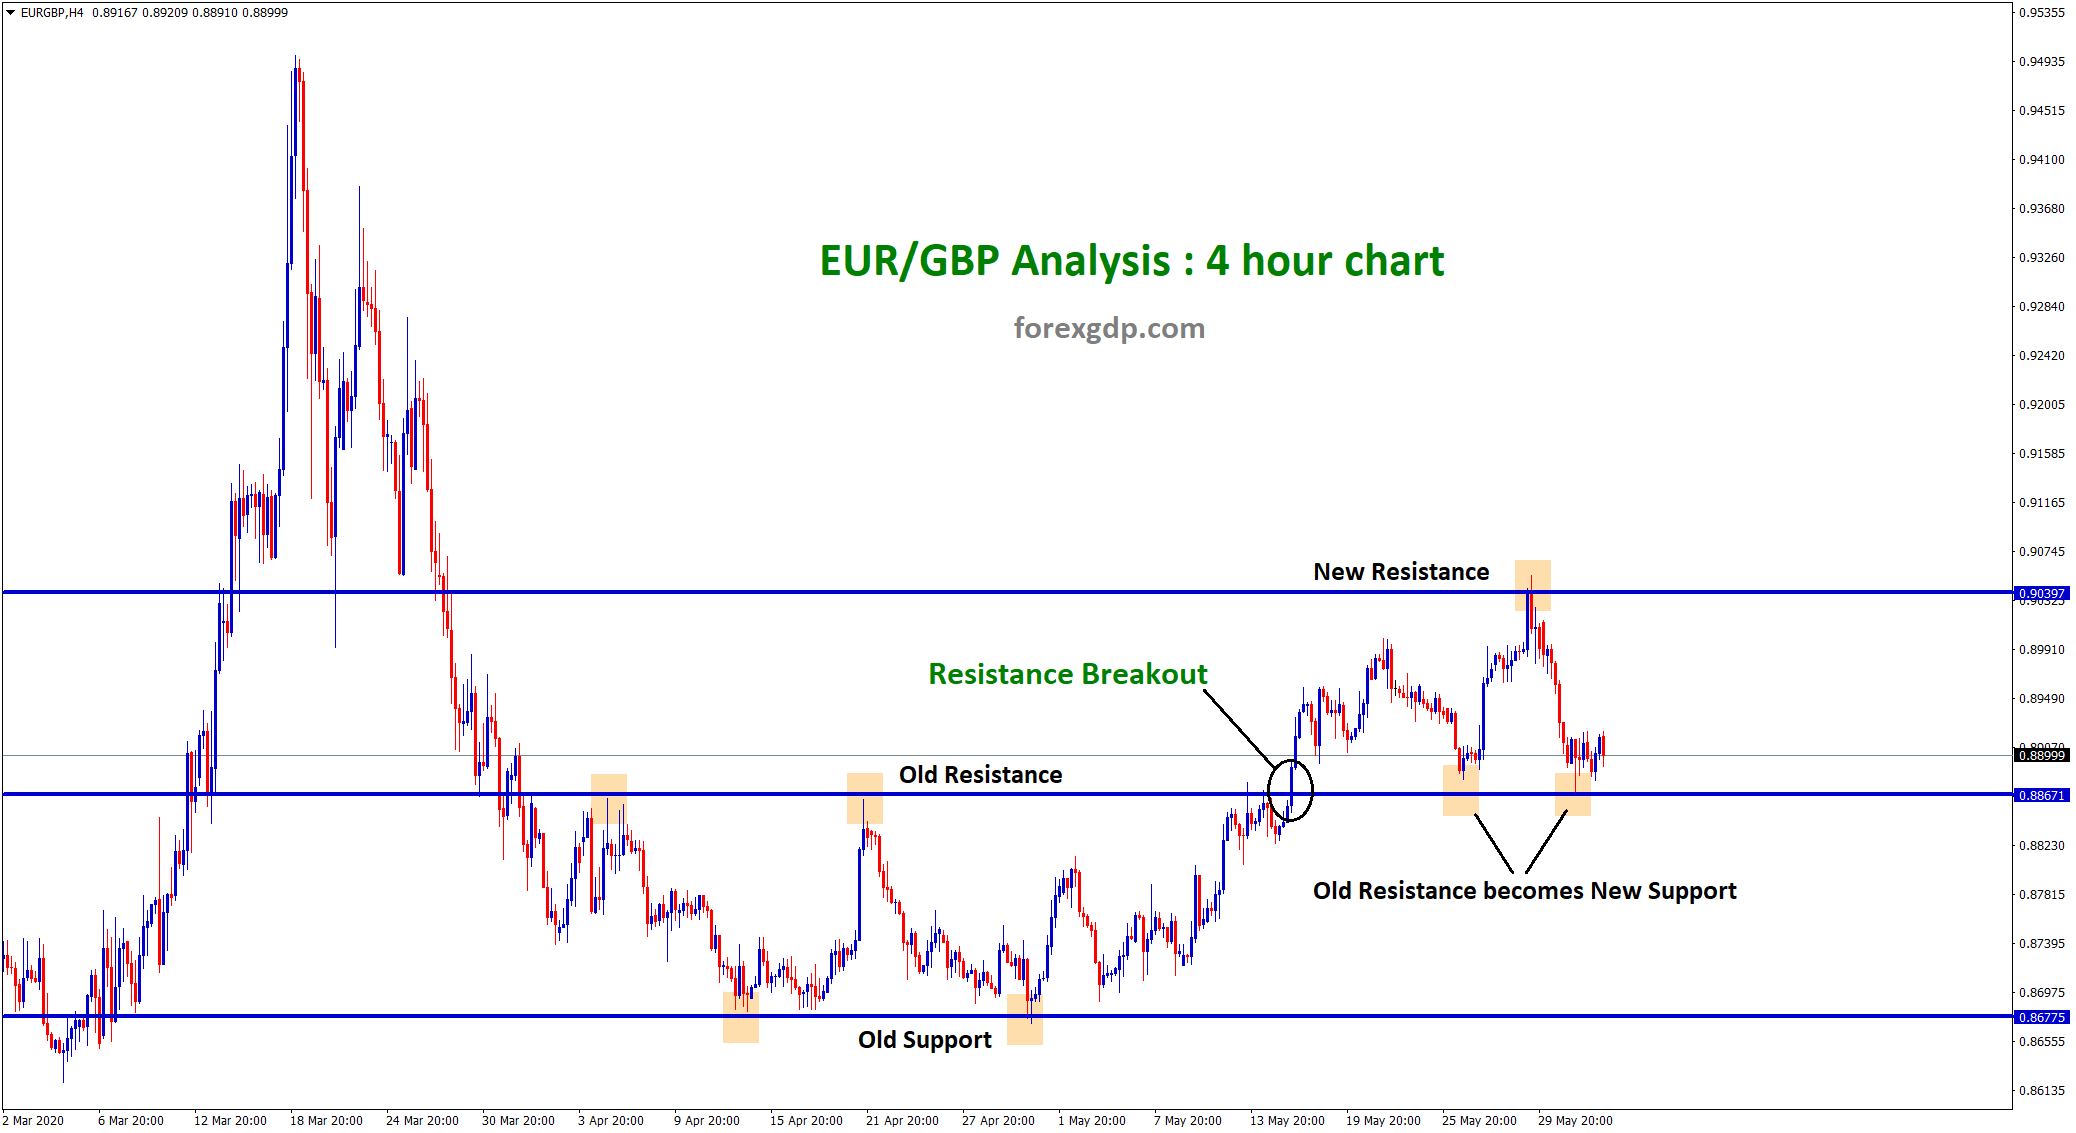
EURGBP Support Resistance Analysis (SR Strategy) ✔️EURGBP broken the resistance level recently. After breakout, New resistance is formed. ✔️The…
-
USDCAD price fall +3448 points after breakout at Support
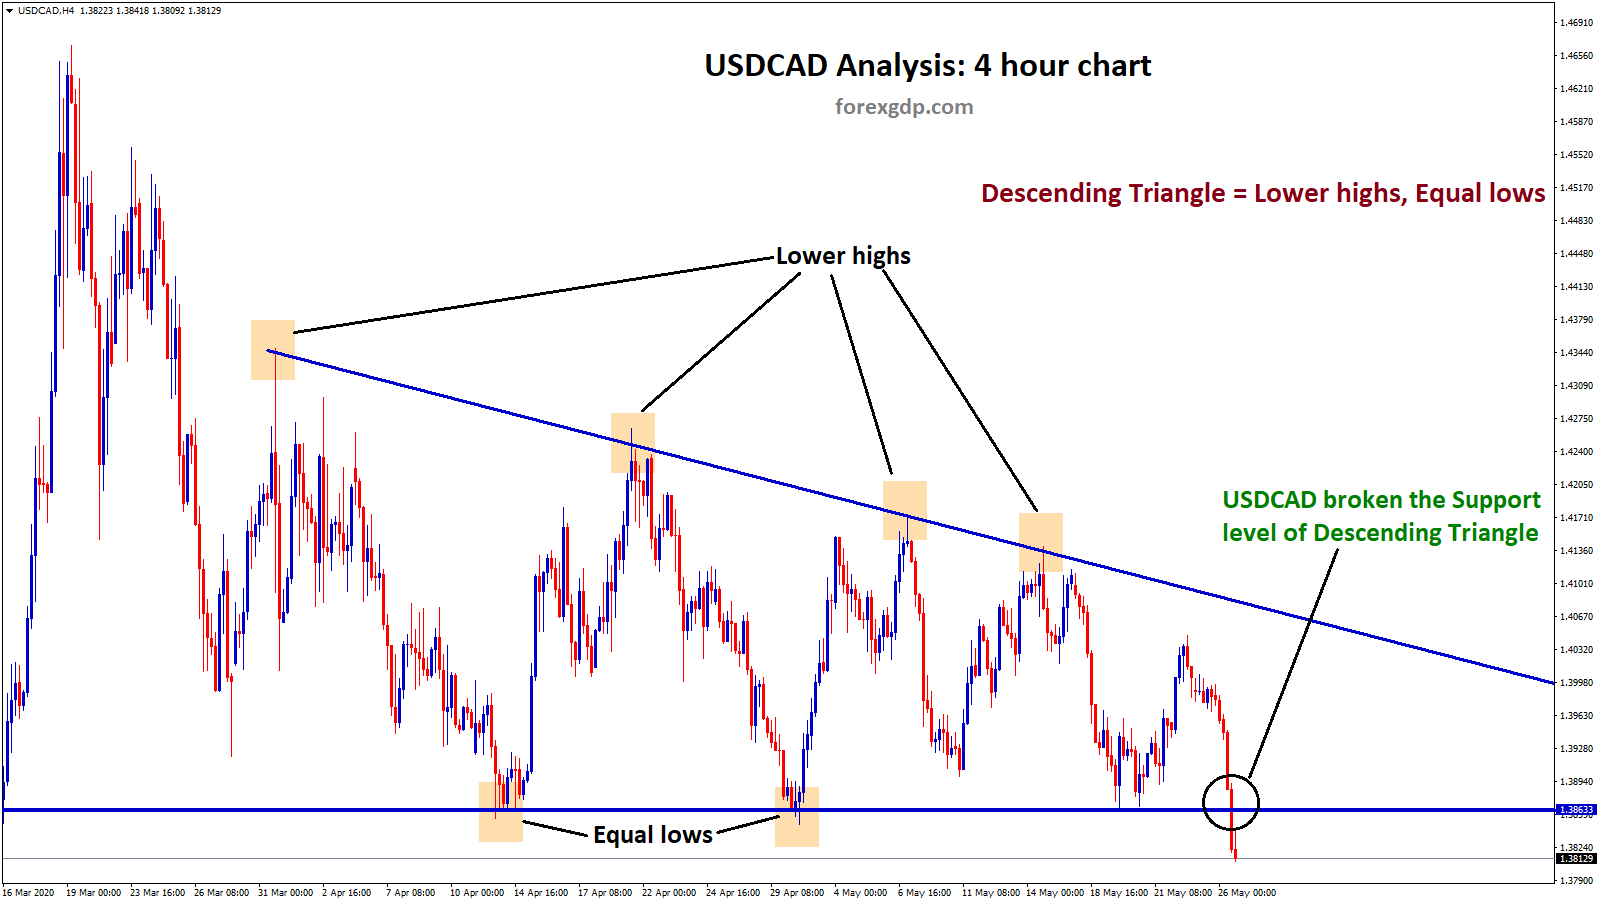
USDCAD Descending Triangle breakout Analysis USDCAD formed a Descending Triangle pattern in 4 hour chart. We wait for long time…
-
+4000 Points CADJPY Flew up after retesting breakout level
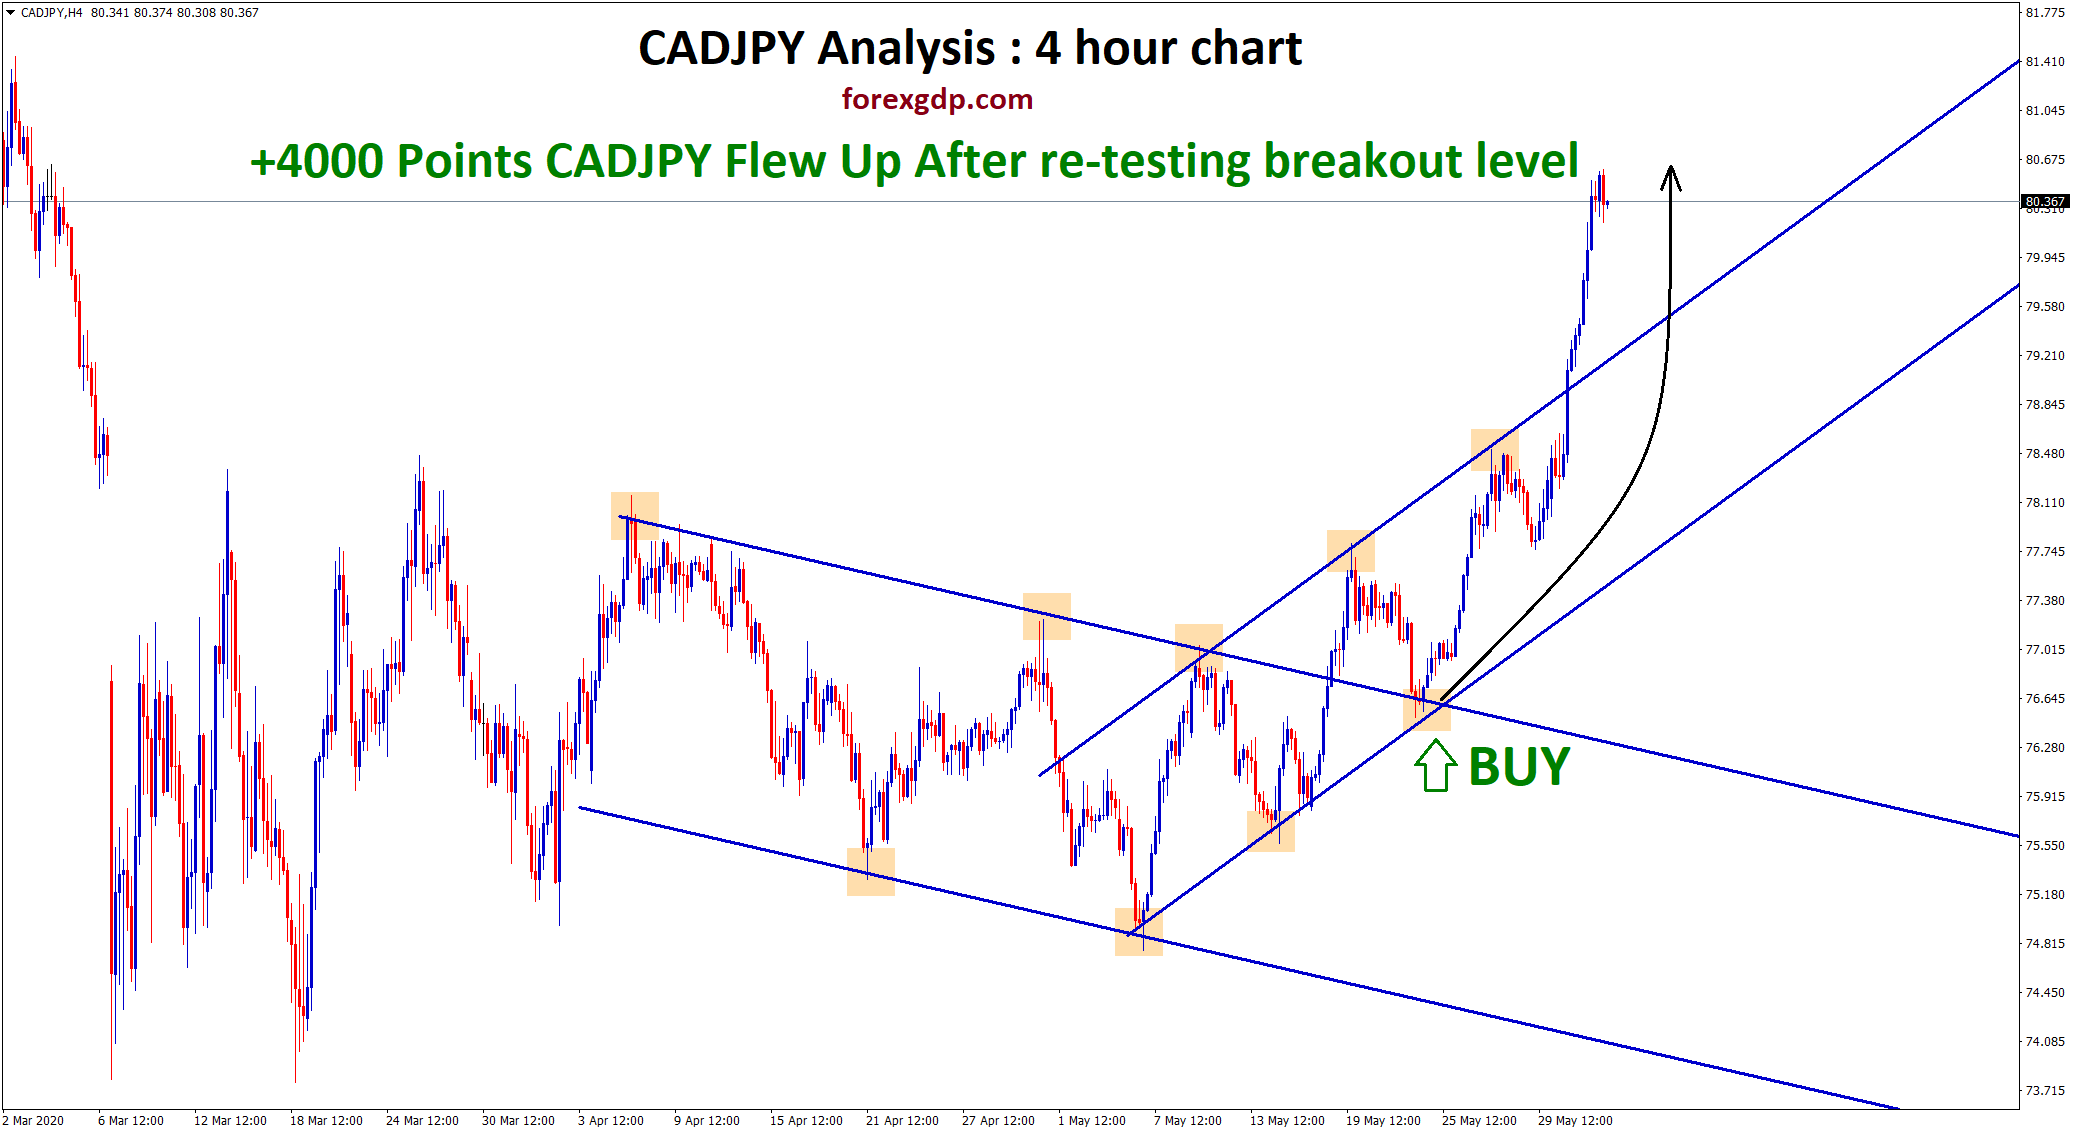
CADJPY Breakout and Retest Analysis After breakout happened at the top level, CADJPY Buy signal is given. Check the previous…
-
Symmetrical Triangle broken on USDCHF after long time
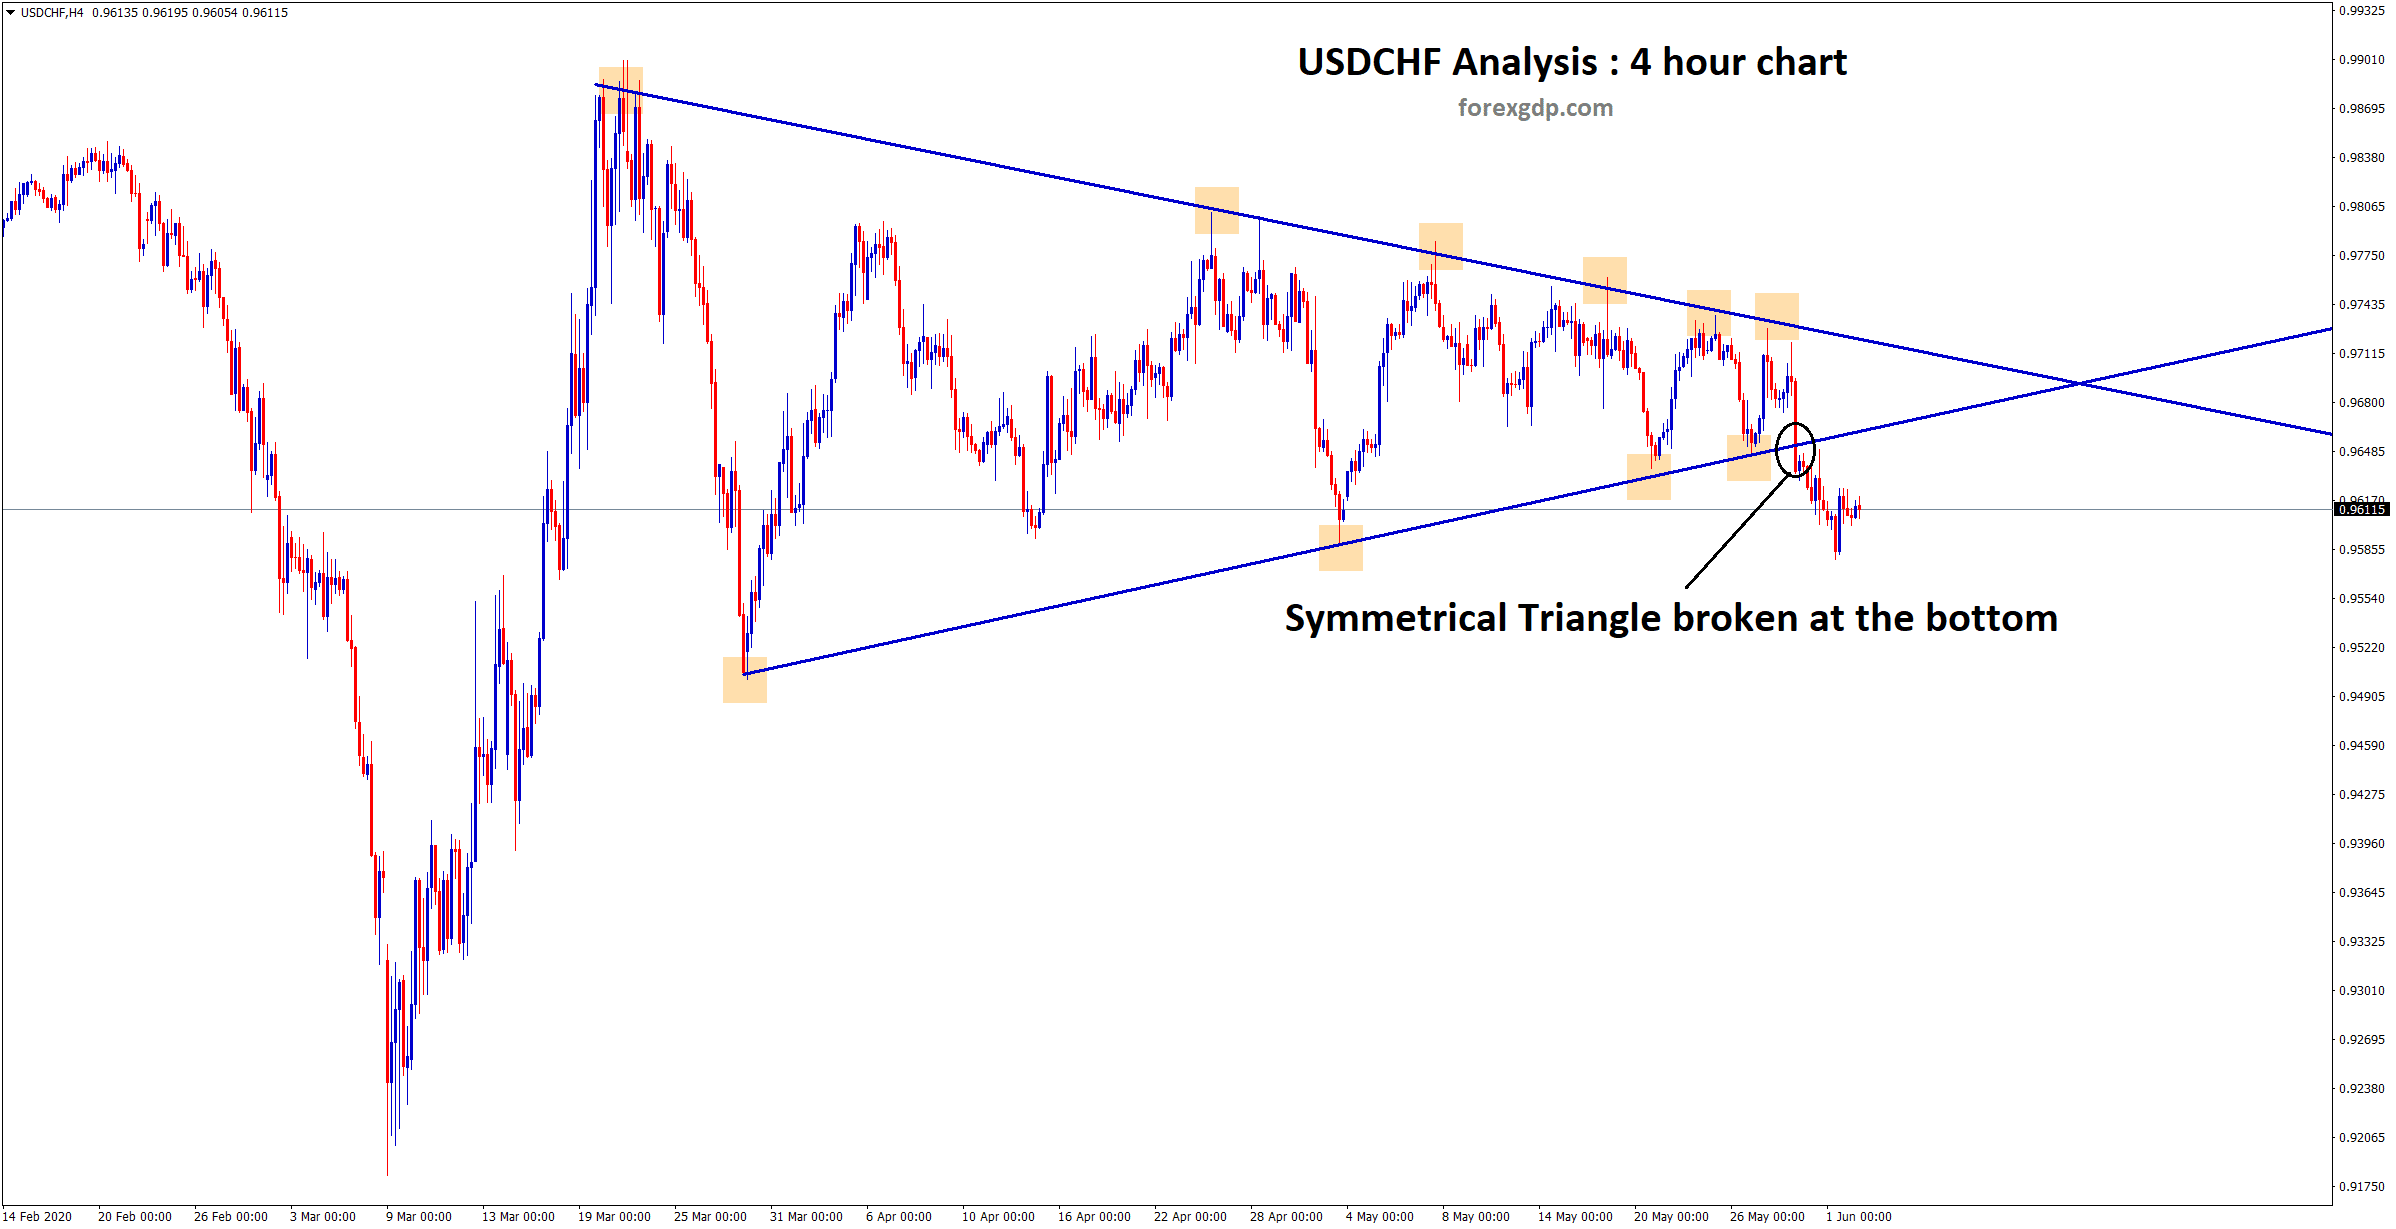
USDCHF starts to fall after a breakout We are waiting for a long time for this symmetrical Triangle breakout (check…
-
Since from 1978, EURUSD moving in an Up Trend
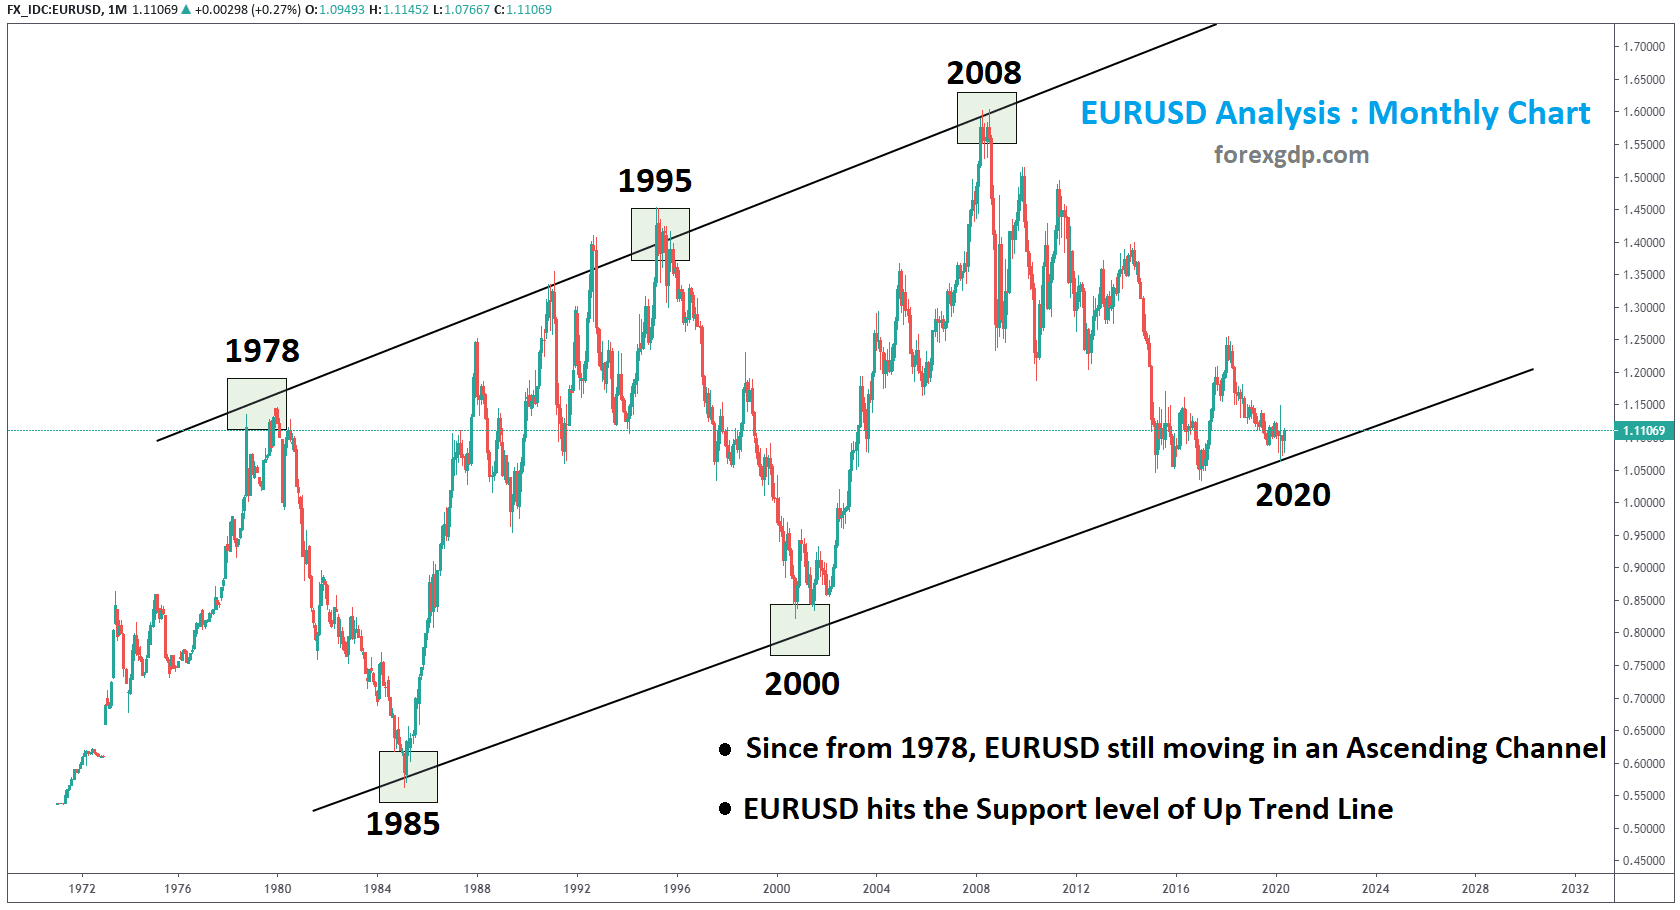
EURUSD History Chart Analysis From the year 1978 to till now in 2020, EURUSD is moving in an Uptrend by…
-
Gold standing at the top zone of the Down Trendline
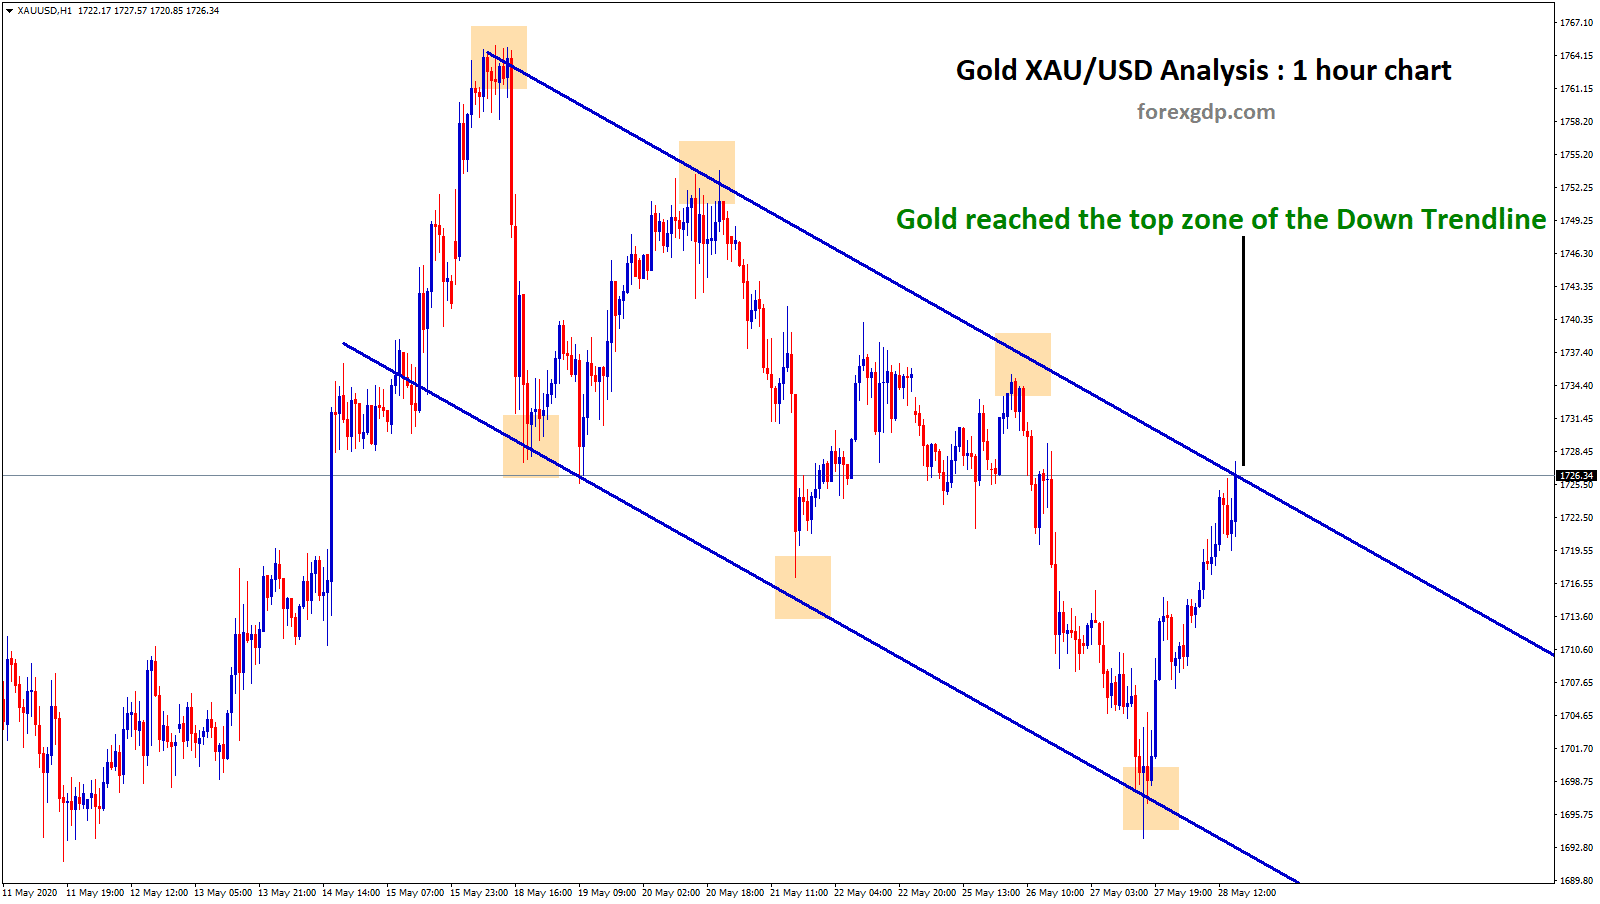
XAU/USD Down Trend Analysis Gold is moving in a down trend by forming lower highs, lower lows in 1 hour…
-
Japan Economy getting worse, USDJPY moving in range.
Today, Japanese government released it's monthly economic assessment report for May month and they said again that the Japan economy…
-
AUDCAD starts to fall from the Strong Resistance in Daily Chart
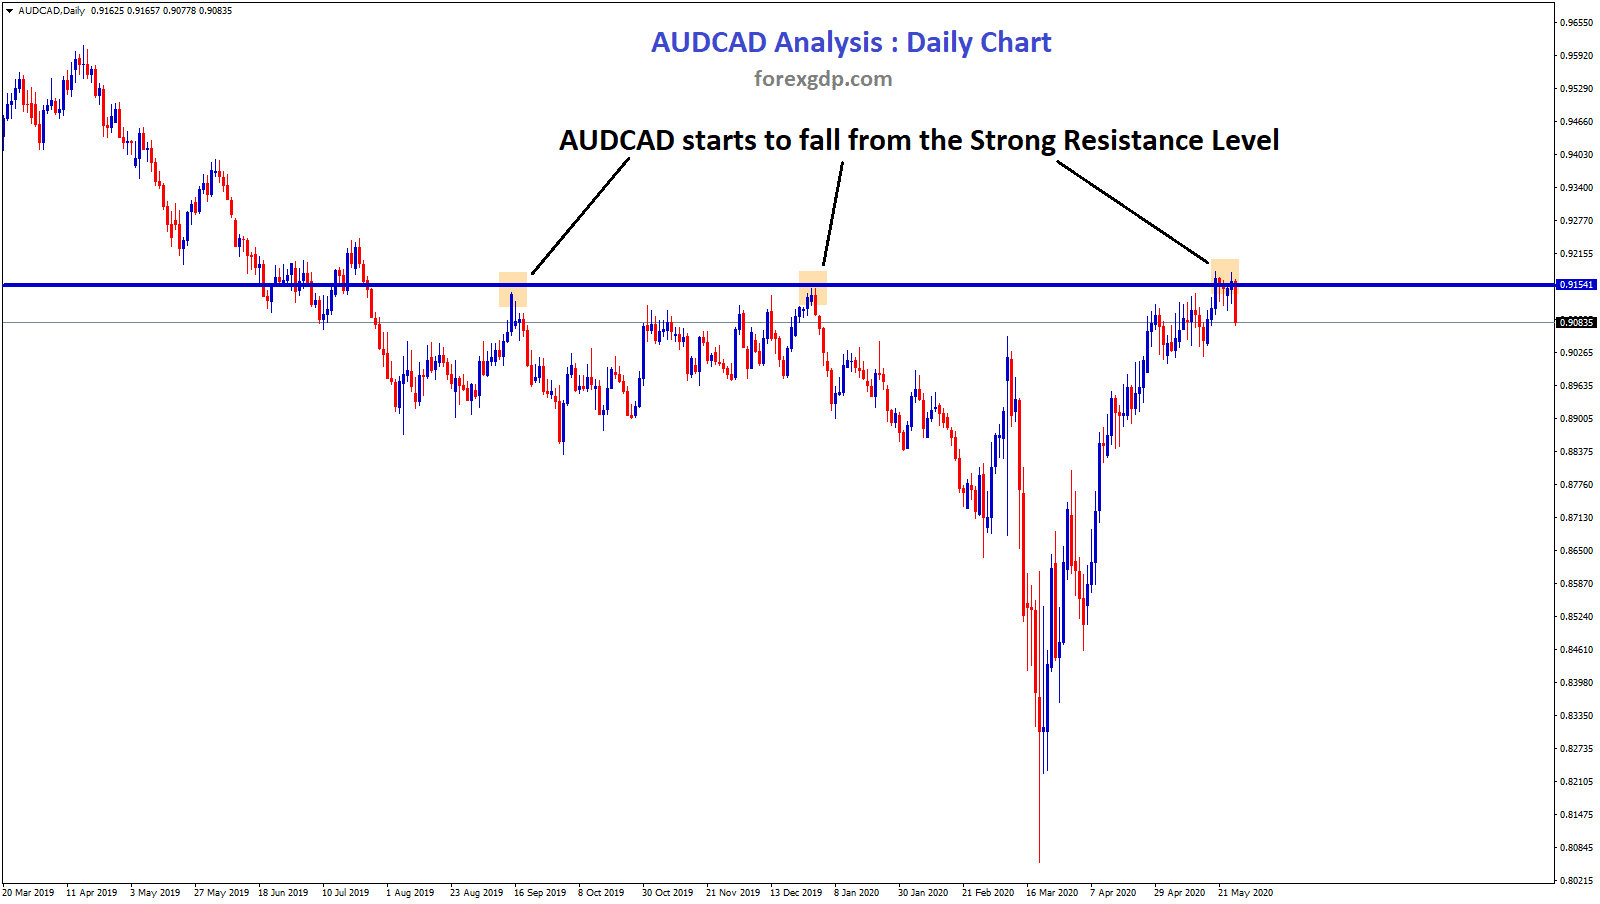
AUDCAD Resistance Level analysis AUDCAD is standing at the Strong Resistance level for long time. Now market starts to fall…
-
USDCHF Triangle going to break soon
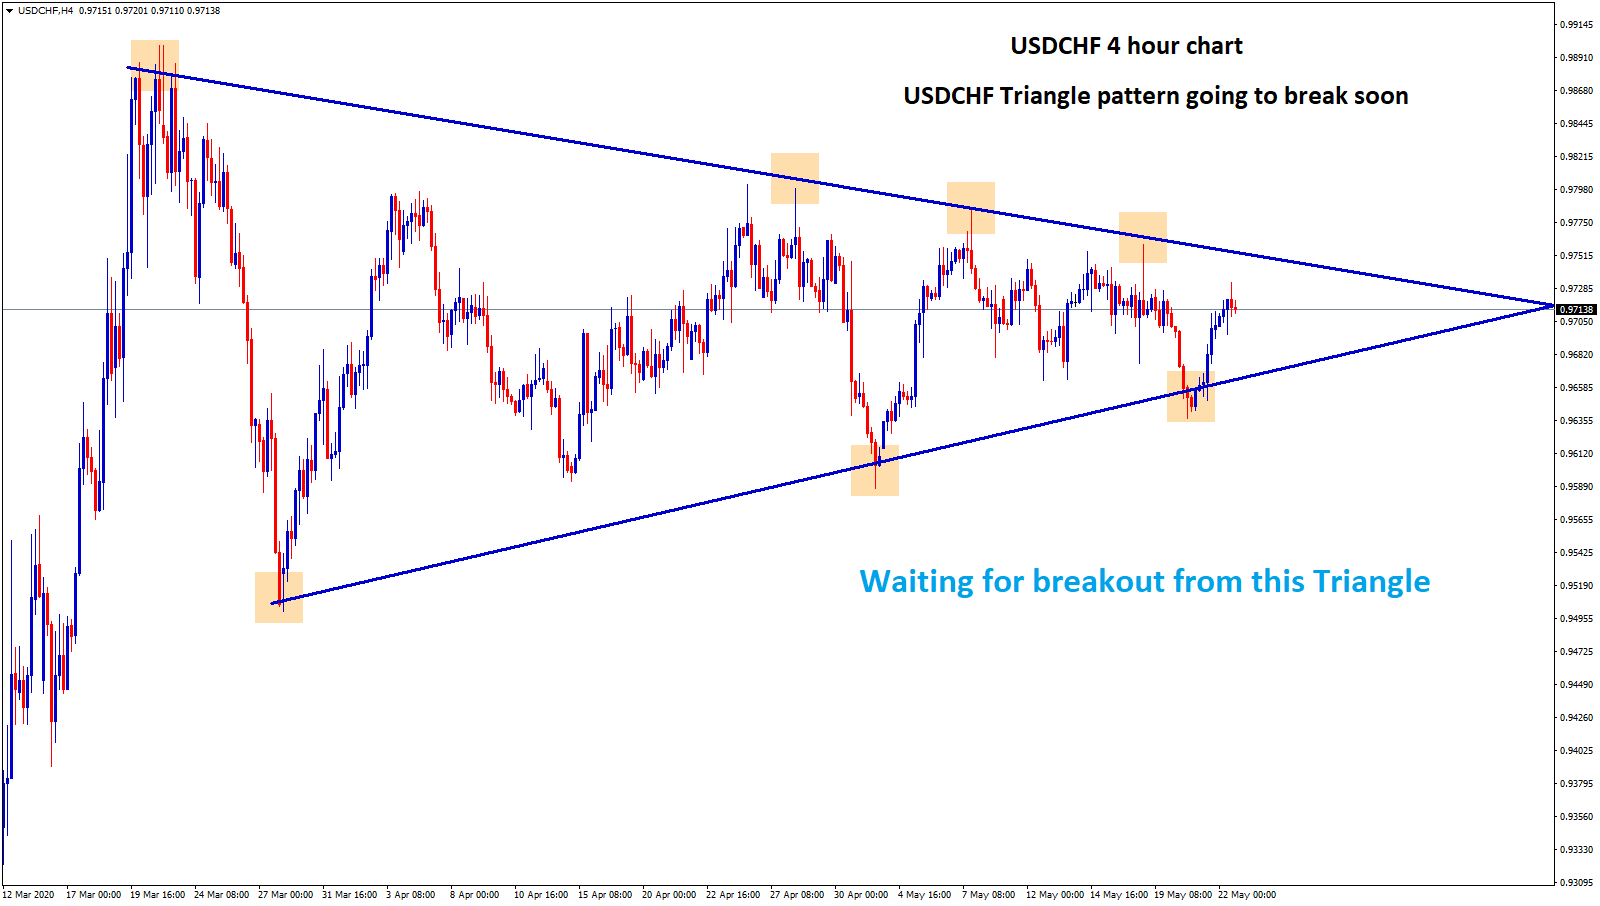
USDCHF Triangle chart pattern in four hour time frame USDCHF is moving up and down between the Triangle price range…
-
EURUSD retesting the Triangle breakout and CADJPY hits Trendline Support
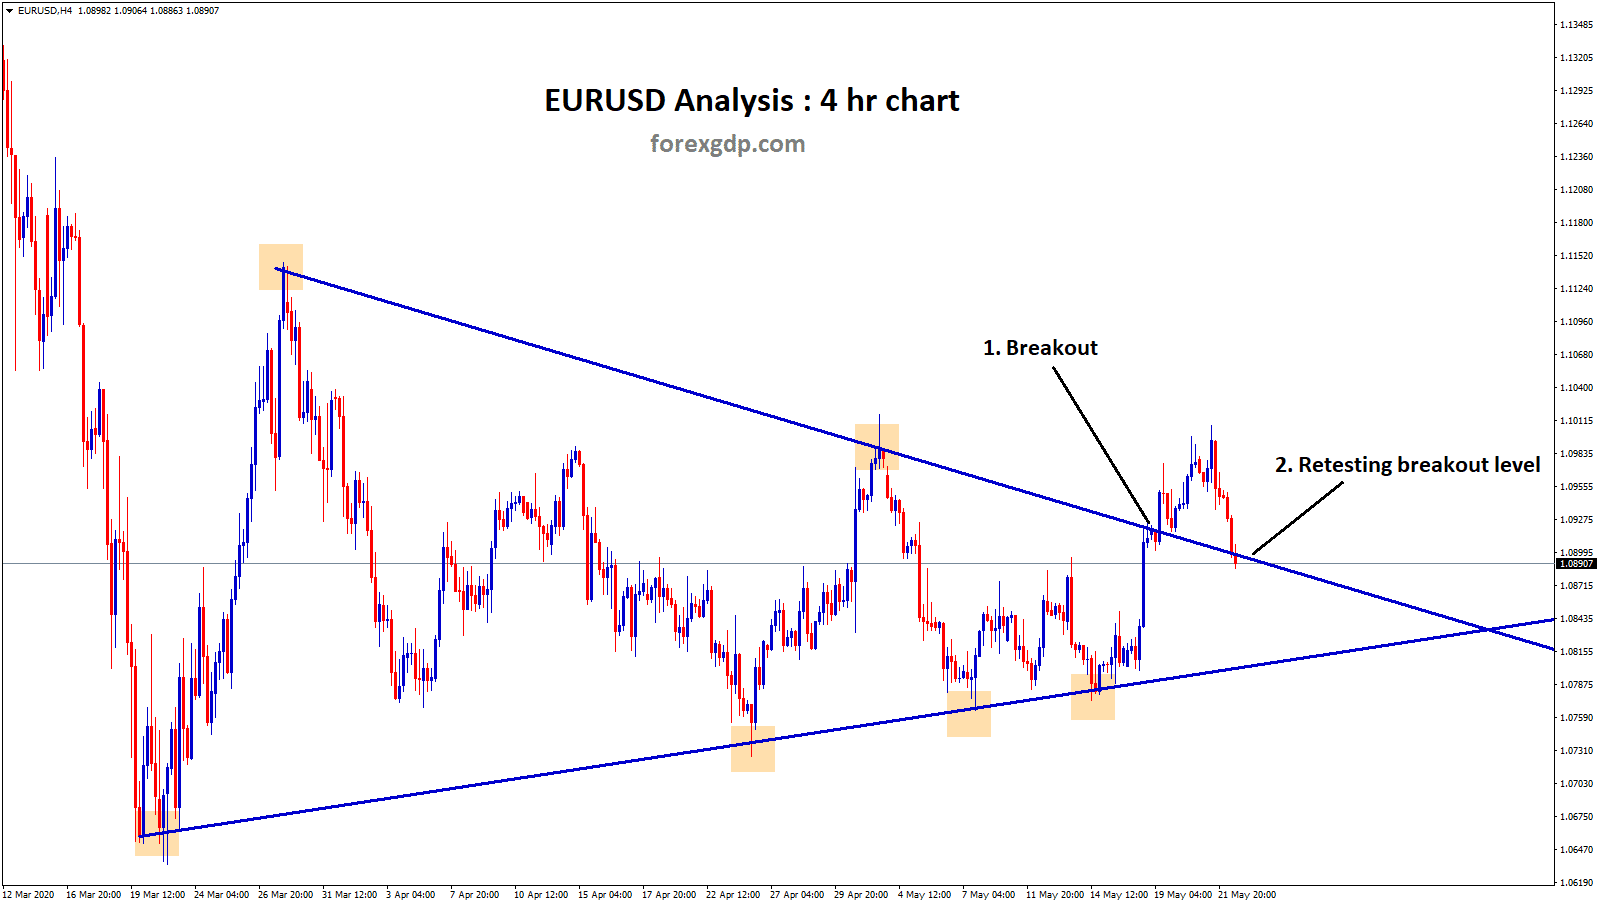
Forex Market Analysis for Education Purpose EURUSD retesting the Triangle breakout level EURUSD broken the top level of the Symmetrical…
-
Descending Triangle pattern in USDCAD. Wait for breakout.
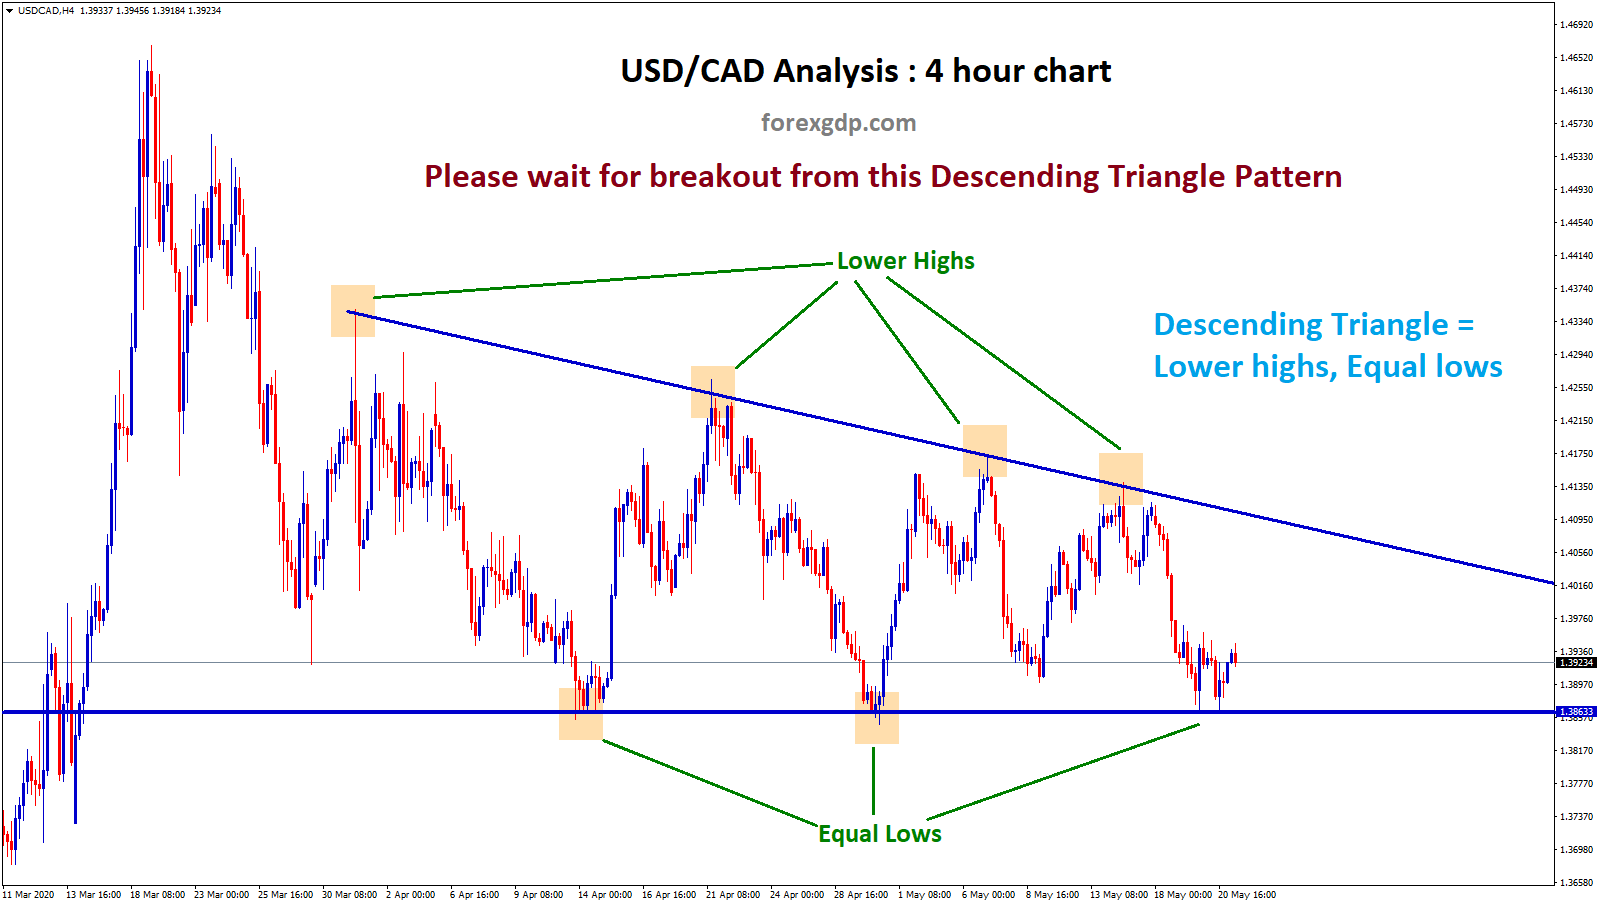
USDCAD Descending Triangle chart pattern USDCAD creates a chart structure with lower highs and equal lows. it's moving in a…
-
Symmetrical Triangle Pattern on EURUSD USDCHF
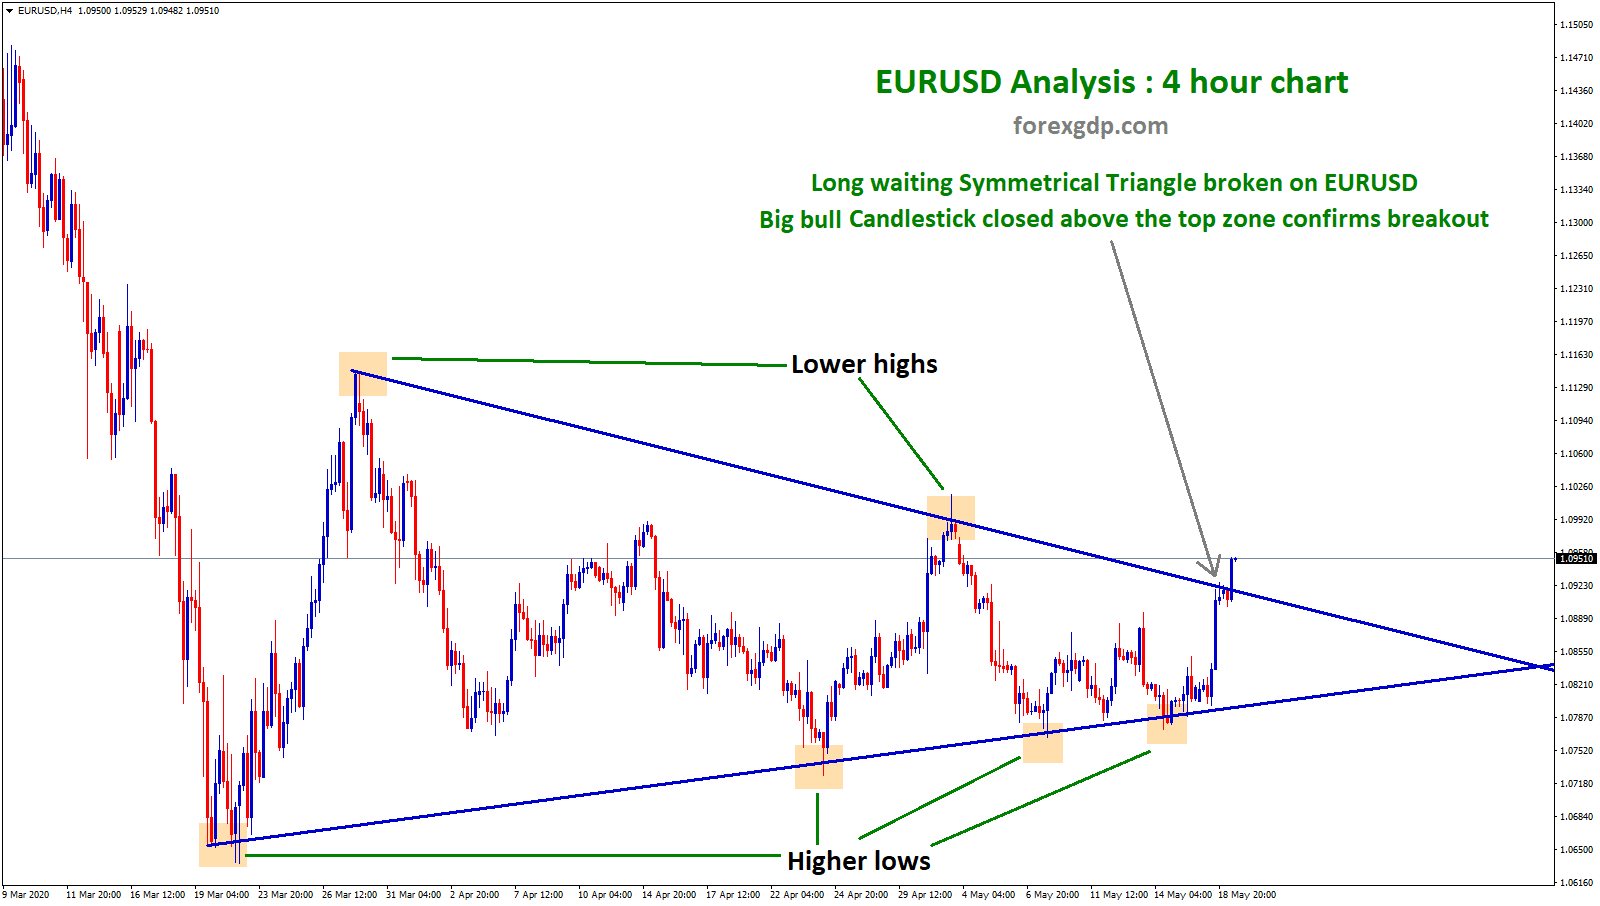
Symmetrical Triangle broken on EURUSD, waiting on USDCHF Lower Highs, Higher Lows creates a Symmetrical Triangle Pattern. Symmetrical Triangle pattern…
-
GBPUSD moving in downtrend
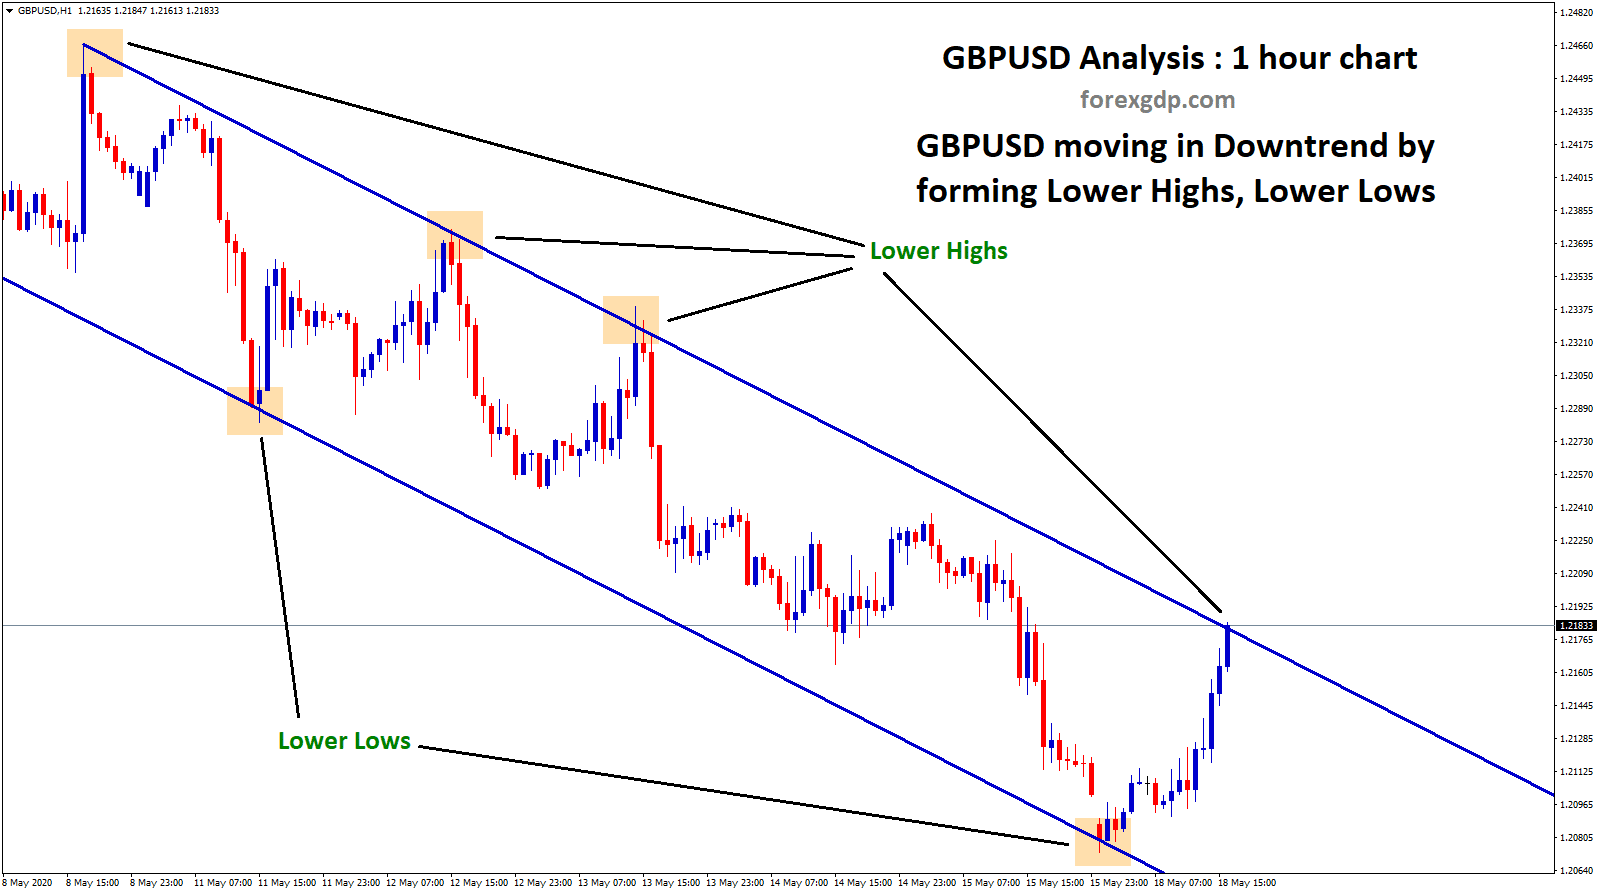
GBPUSD Double Top Chart Analysis GBPUSD formed a double top in 4 hour chart. Recently, market broken the bottom zone.…
-
EURGBP Resistance Zone broken after 45 days!
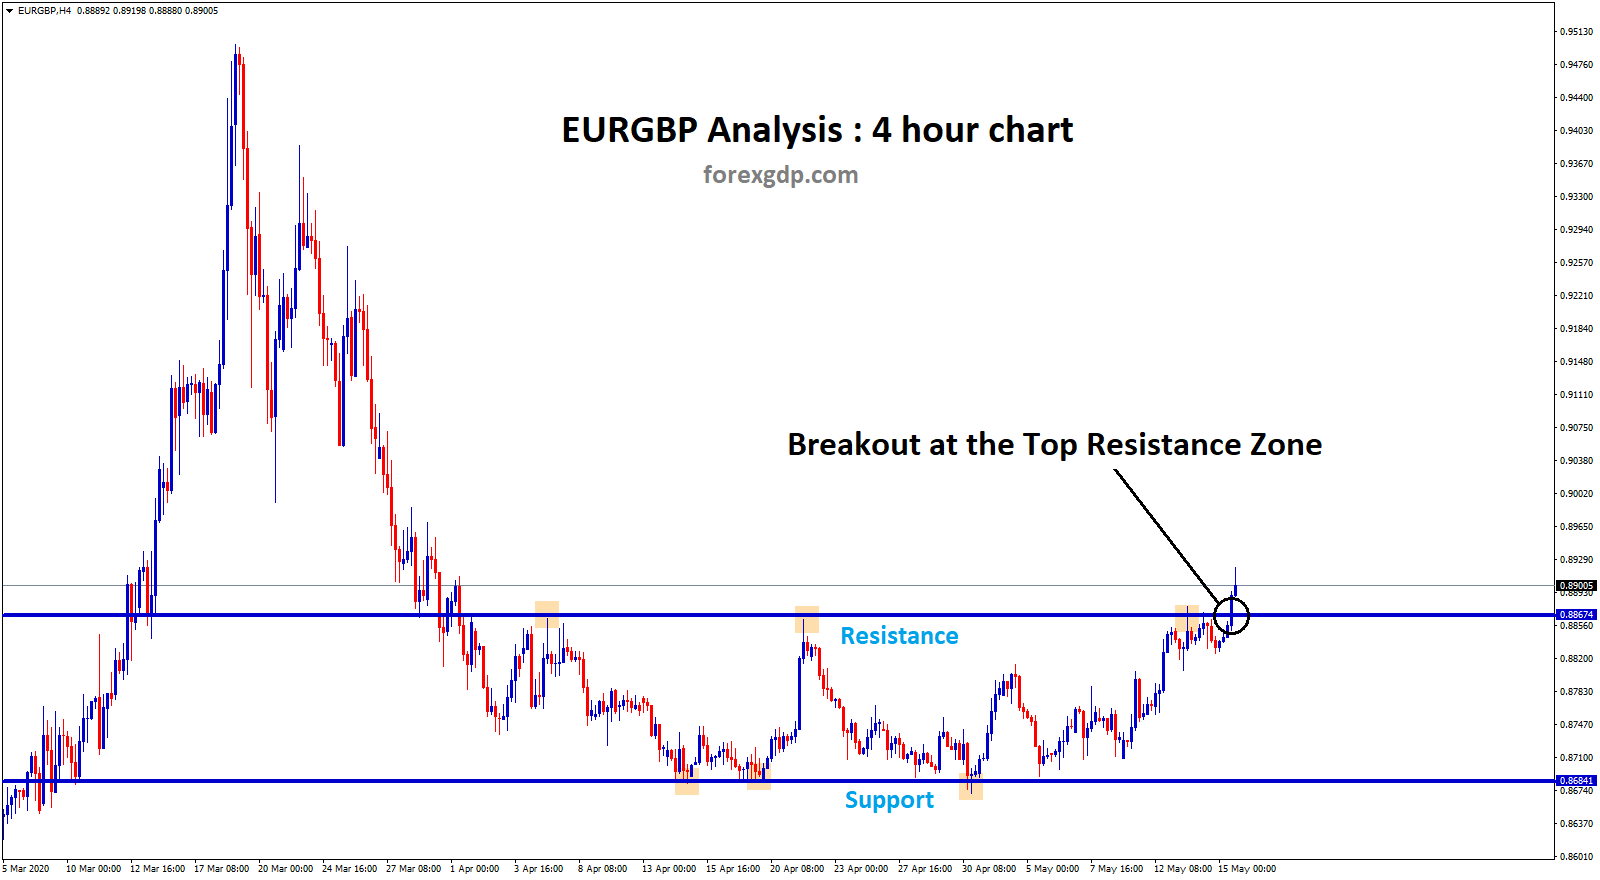
EURGBP Support and Resistance Analysis EURGBP moved up and down between the Resistance and Support Zone in 4 hour chart.…
-
USDCAD soared +229 pips in last 24 hours
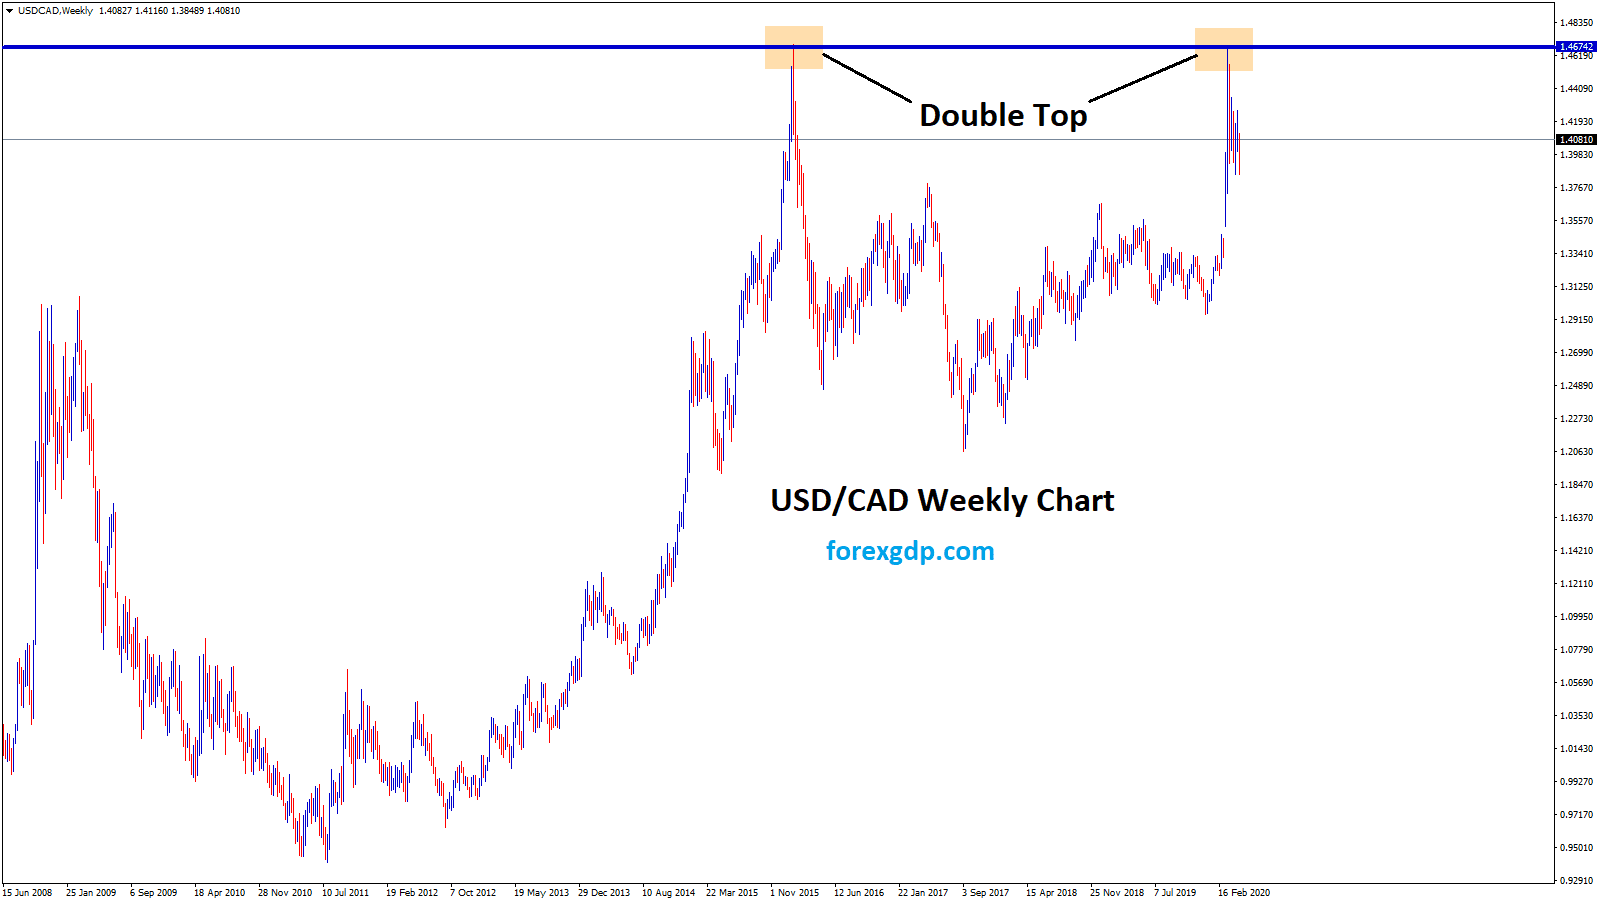
USDCAD Price forecast from the support Before 24 hours, we have updated that "USDCAD landed in the support zone" check…