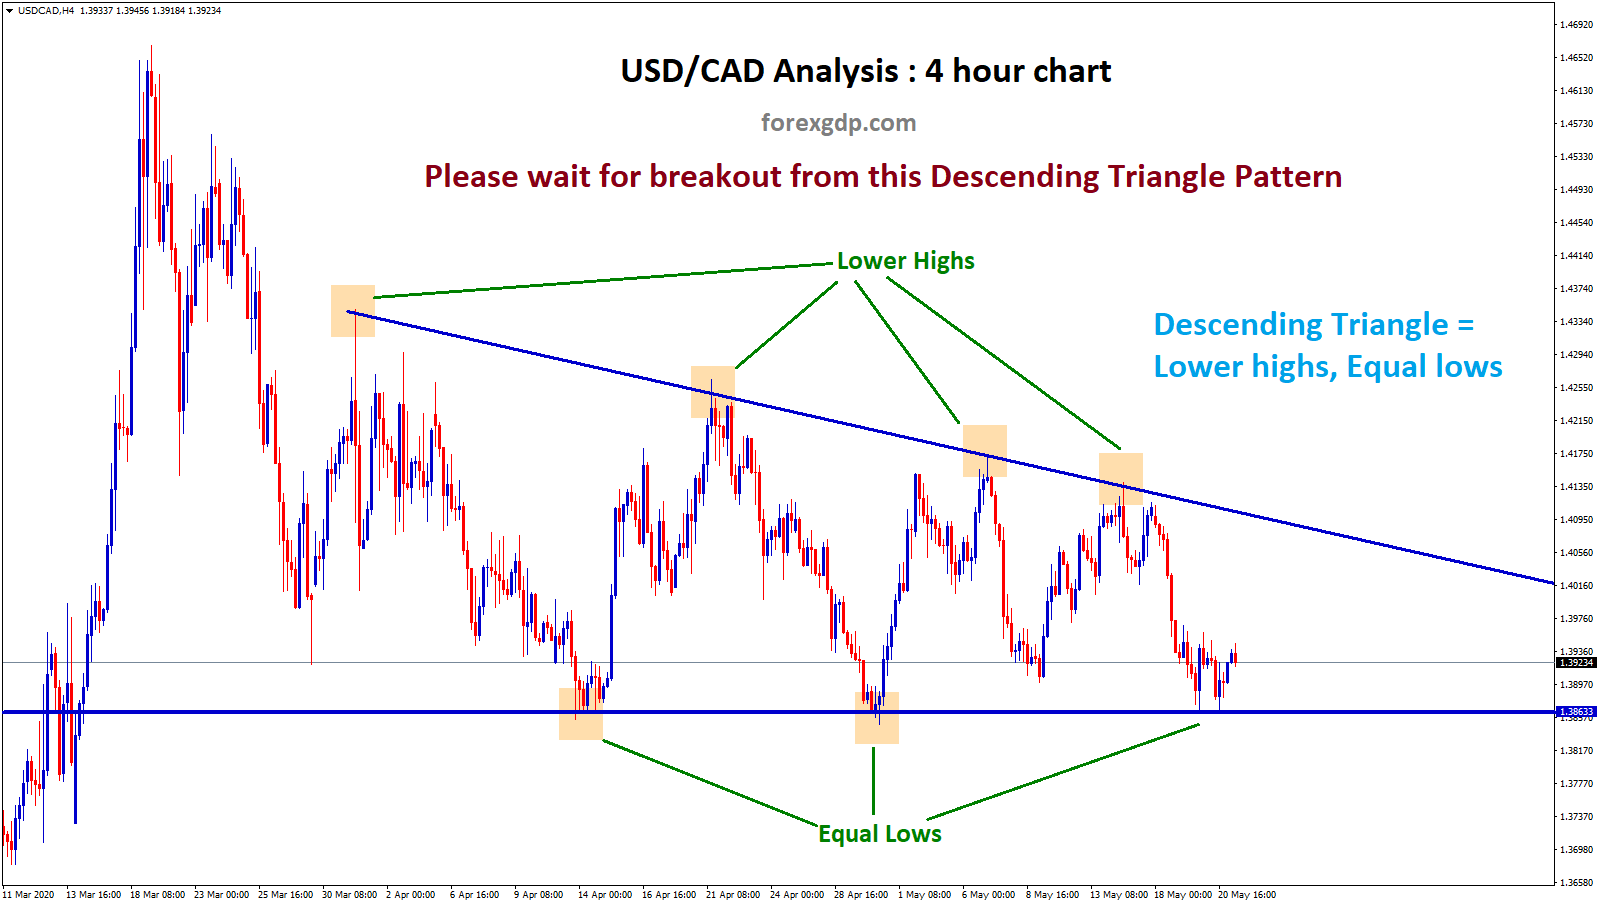
USDCAD Descending Triangle chart pattern
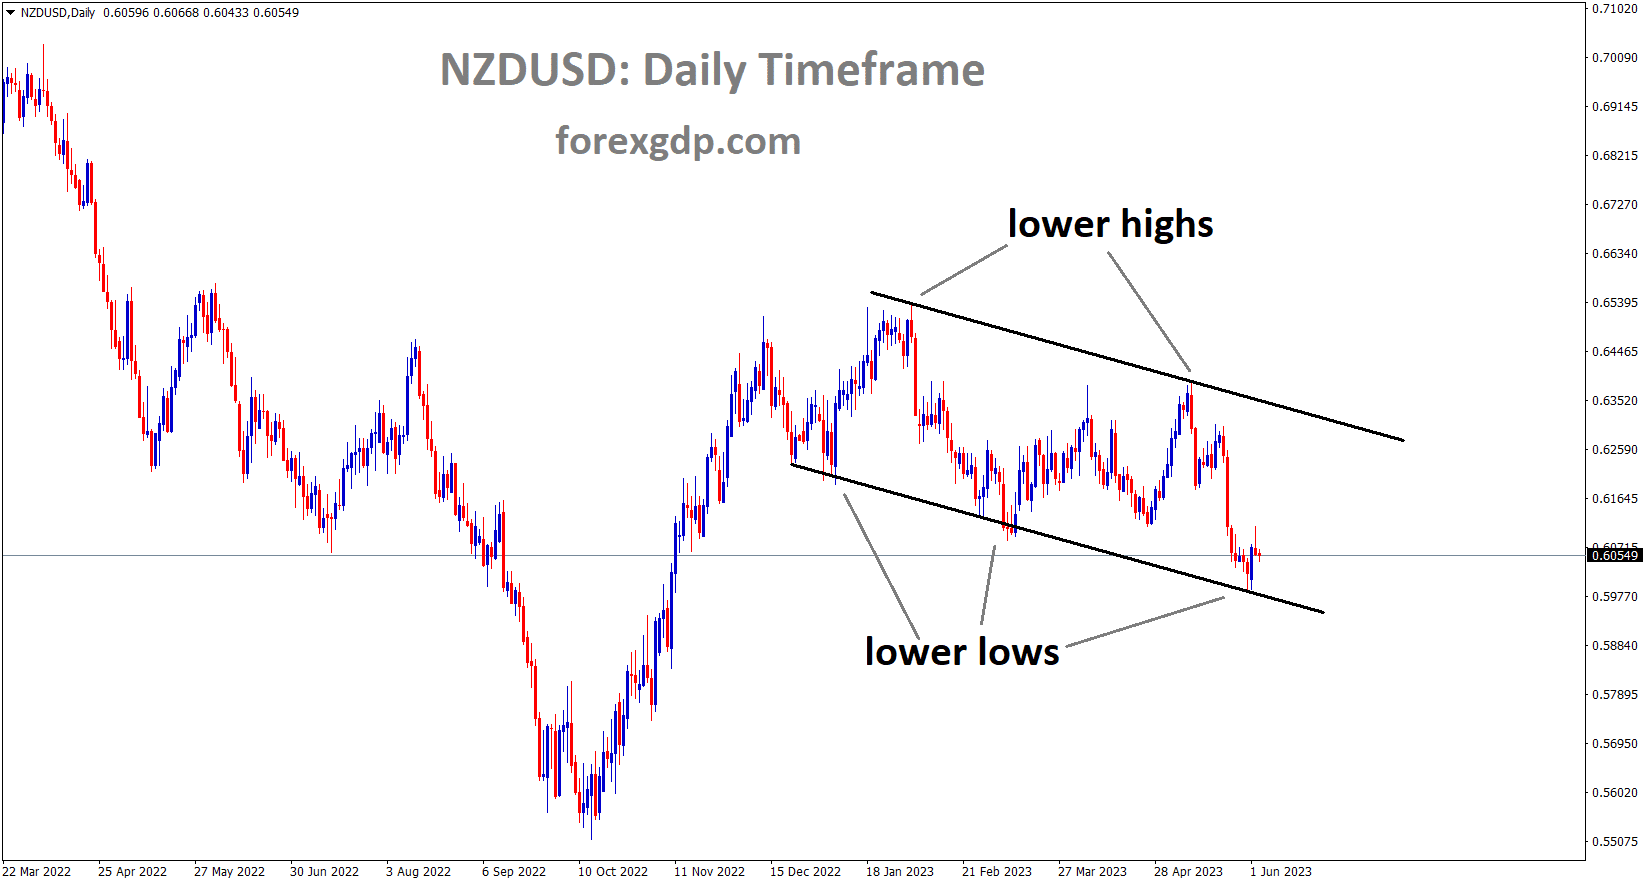
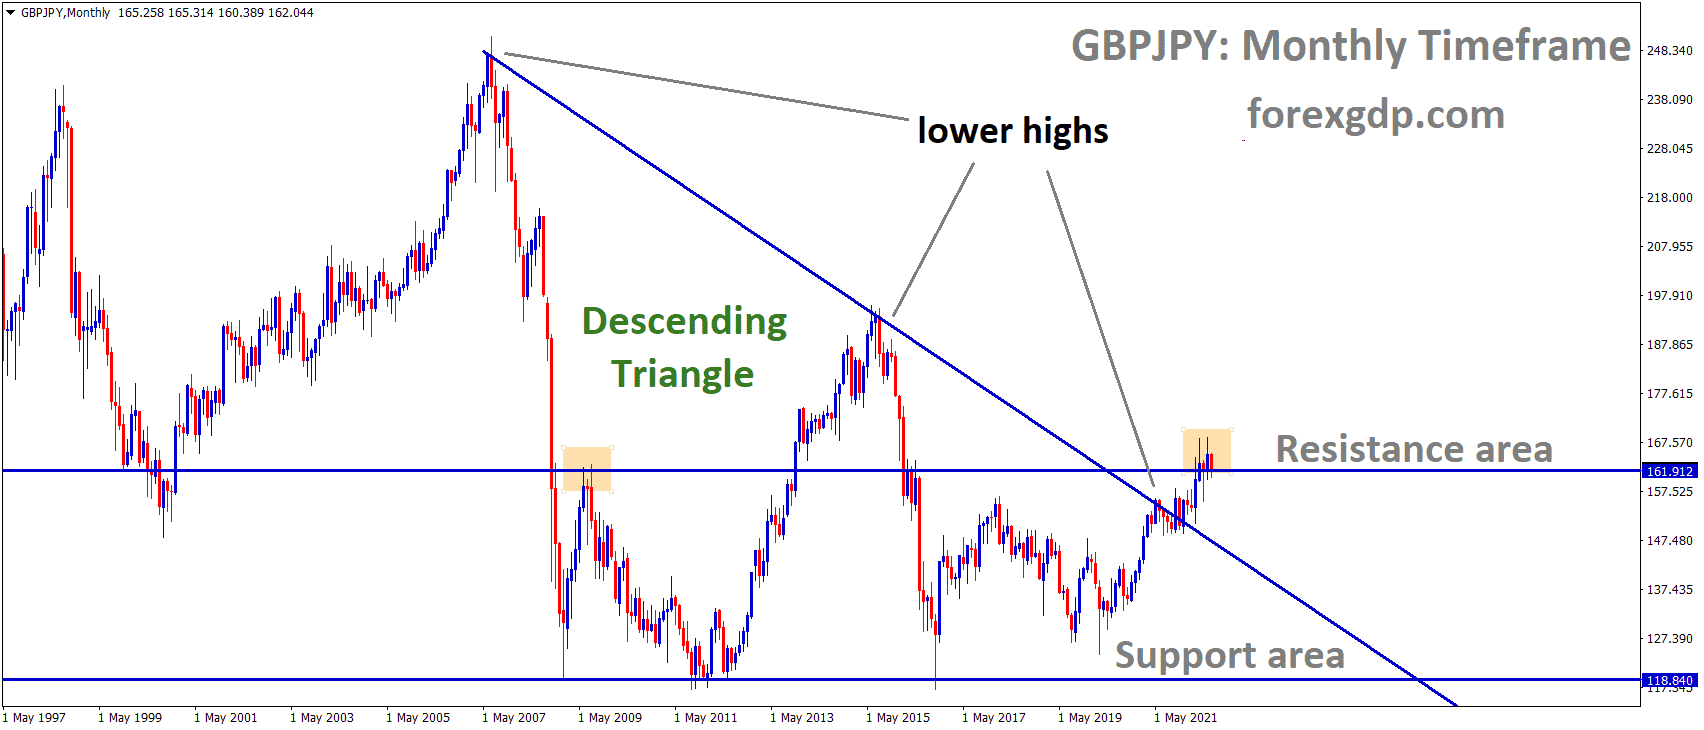
USDCAD creates a chart structure with lower highs and equal lows.
it’s moving in a Descending Triangle pattern.
let’s wait for the confirmation of breakout from this descending triangle.
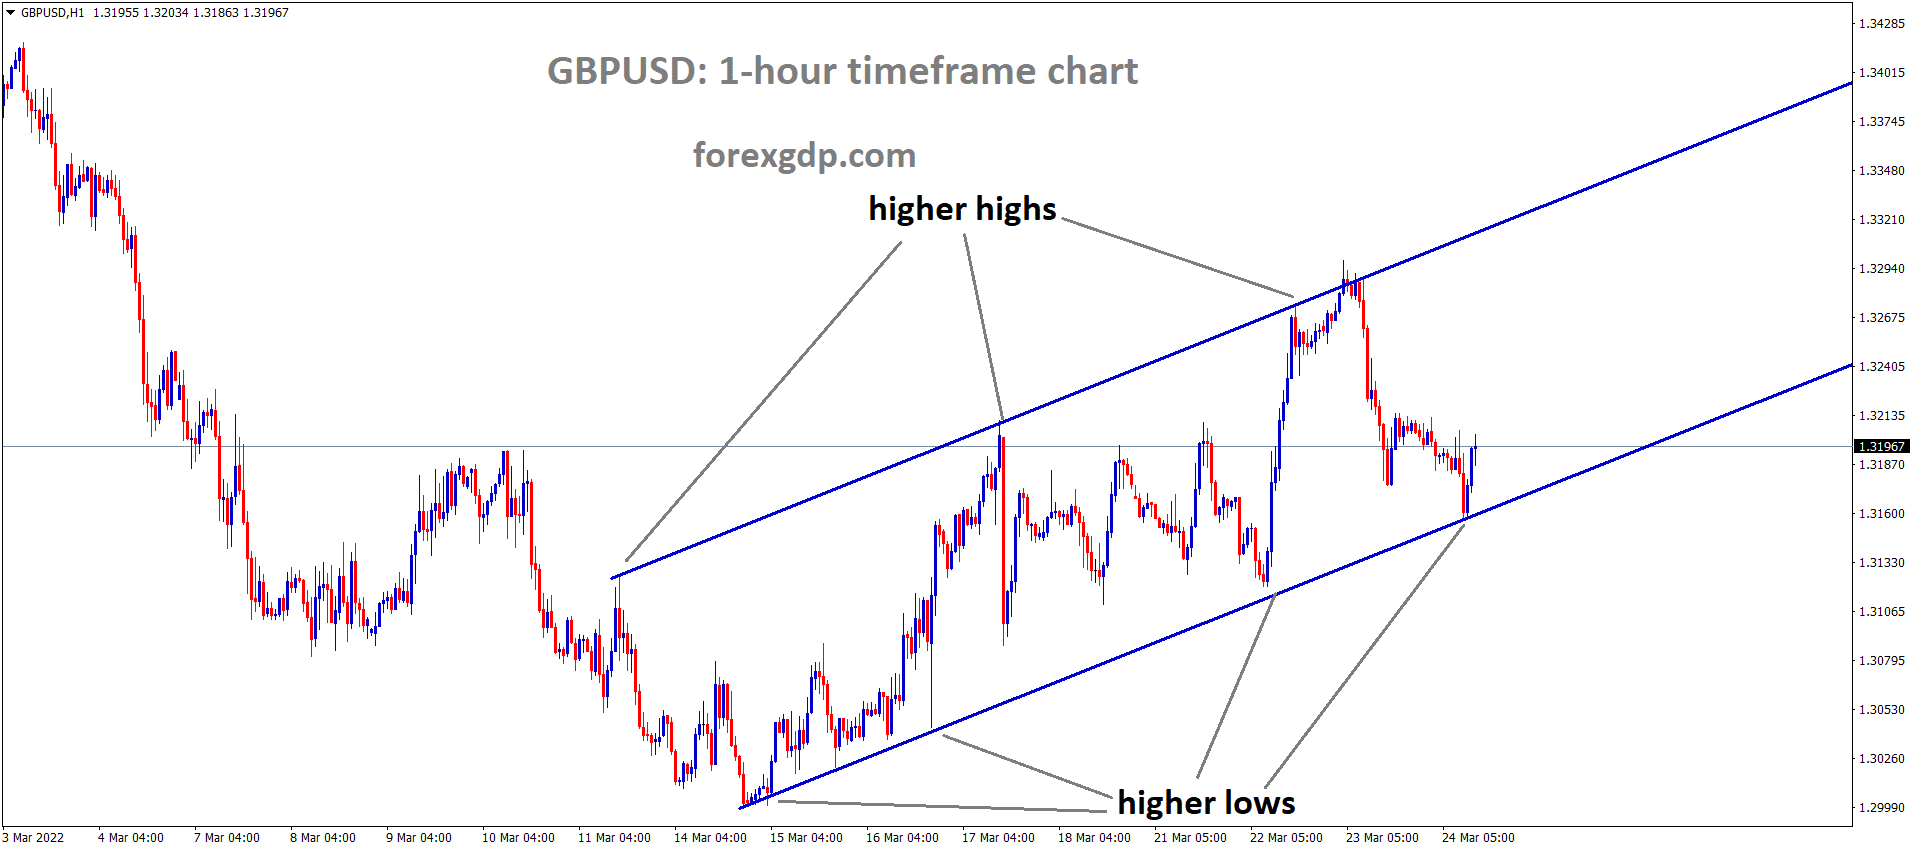
In another view, USDCAD forms a symmetrical triangle in 1 hour chart

After breakout happened at the bottom level of the symmetrical triangle, market re-tested the broken level twice.
Education notes:
Symmetrical Triangle = Lower highs, Higher lows
Descending Triangle = Lower highs, Equal lows
Check live Free forex signals now.
To increase your trading profits, read this below topics:
How to trade profitably using Chart Patterns?
Low risk, High reward trading strategies
How to get rich trading forex market?
Most predictable Currency Markets
If you want to learn more successful trading techniques with free mentorship support, you can purchase the forex trading video course.
Thank you.